Objective: The Yale insulin infusion protocol (IIP) is one of the best available IIPs, considered safe and effective for treatment of critically ill patients. We modified the original Yale IIP and built a simple computer-program-based IIP to fit Japanese patients, who were normally known to be less obese and less insulin-resistant. We compared the appropriateness of our IIP with empirical management of insulin infusion in intensive care unit (ICU) patients.
Methods: We examined blood glucose transitions of ICU patients who had undergone cardiac surgery at Keio University Hospital. The infusion protocol (IP) group contained 17 patients in whom the blood glucose levels were controlled using the IIP. The empirical control (EC) group consisted of 14 patients in whom the blood glucose levels were controlled by empirical continuous insulin infusion that was manually determined by the attending doctors.
Results: There was no significant difference in the percentage of achieved target blood glucose level between the IP group and EC group. The frequency of hypoglycemia and glucose every 3 hours during the first 36 hours after ICU admission were also equivalent statistically. There was no difference in adverse event in both groups.
Conclusions: Our IIP controlled blood glucose levels in the patients who underwent open-heart surgery were equally well and safe as previous empirical therapy. These findings suggest that our IIP with less burden is both efficient and safe in blood glucose management of Japanese patients.
Hyperglycemia at the onset of acute critical illness is related to the prognosis of patients [1]. The development of stress hyperglycemia is caused by increases in counter-regulatory hormones such as catecholamines, growth hormone, cortisol, and cytokines [2,3]. These derangements of hormones and cytokines lead to excessive hepatic glucose production and insulin resistance [2,3]. Furthermore, hyperglycemia also exacerbates inflammatory and oxidative stress responses, which cause a vicious cycle whereby hyperglycemia leads to further hyperglycemia [4-6]. As stress hyperglycemia is mediated by these inflammatory and neuroendocrine derangements, and resolution of hyperglycemia is associated with normalization of the inflammatory response, the intervention in stress hyperglycemia can be associated with improved clinical outcomes [6].
There have been several studies of safe and effective insulin infusion protocols (IIPs) [7-9], and the Yale IIP is one of the best available IIPs [7]. We modified and translated the Yale IIP, which was designed for patients in Western countries, to fit Japanese patients because Asian diabetic patients are less obese and less insulin-resistant than the diabetic patients of the Western countries [10]. Considering some recent studies and guidelines [11-15], we also translated the target blood glucose levels from 100139 mg/dL in the original protocol to 140-180 mg/dL, although the target blood glucose level was changed to 120-160 mg/dL in the revised Yale IIP [16]. Though the target blood glucose levels were set mildly, we still need to measure blood glucose and adjust the insulin infusion rate frequently.
Furthermore, we also used the insulin sliding scale in cases of fluctuated blood glucose levels, but it did not always fit the situations, especially in the intensive care setting. Therefore, the attendant nurses who worked in an intensive care unit (ICU) environment had to frequently report the result of every blood glucose measurement to either the cardiologist or diabetologist. To avoid medical accidents from verbal instruction, doctors and nurses were required by our hospital regulation to communicate directly with each other, without using a phone. As various medical professionals such as cardiac surgeons and diabetologists as well as nurses are engaged in blood glucose measurements and insulin infusion orders, a simplified IIP is desirable in order to avoid errors related to complicated IIPs.
We report here that our simple IIP for Japanese patients after openheart surgery has the equivalent efficacy and safety compared to the previous empirical blood glucose control.
This study was a retrospective study to verify the efficiency and safety of our IIP compared to the previous empirical blood glucose control.
Patients
Blood glucose levels in the EC (empirical control) group were controlled by empirical continuous insulin infusion determined by the doctors. The subjects in the EC group were all those who had undergone open-heart surgery at the Keio University Hospital one year before initiating our IIP (between April 2012 and March 2013), and met the following criteria: 1) transferred to the ICU immediately after surgery; 2) Hemoglobin A1c (HbA1c) ≥ 6.0%; and 3) confirmed blood glucose levels in the medical records. In the EC group, we first determined the initial insulin infusion rate and frequency of blood glucose measurements. The doctor empirically adjusted the insulin infusion rate and determined the next timing of blood glucose measurement. Blood glucose levels in the infusion protocol (IP) group were controlled by the IIP. The subjects in the IP group were all those who had undergone open-heart surgery at the Keio University Hospital one year after initiating our IIP (between March 2013 and September 2013), and met the same criteria as that of the EC group. Continuous intravenous insulin infusion was started at the time of admission to ICU after surgery in both groups. The characteristics of the study patients are shown in Table 1. IP was used in 17 patients and EC was used in 14 patients to control blood glucose in the ICU. Surgery for patients consisted of coronary artery bypass graft (n = 5), valve replacement (n = 8), and vascular surgery for aortic aneurysm (n = 4) in the IP group, and coronary artery bypass graft (n = 7) and valve replacement (n = 7) in the EC group.
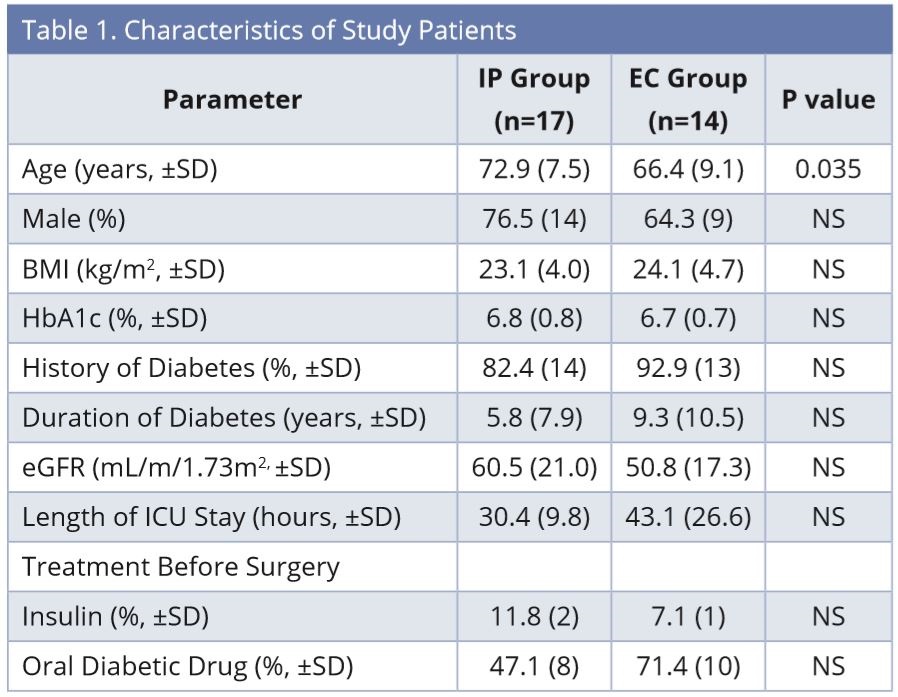
Abbreviations: BMI, Body mass index; EC, empirical control; eGFR, estimated Glomerular Filtration Rate; HbA1c, Hemoglobin A1c; ICU, intensive care unit; IP, infusion protocol; NS, not significant.
Insulin Infusion
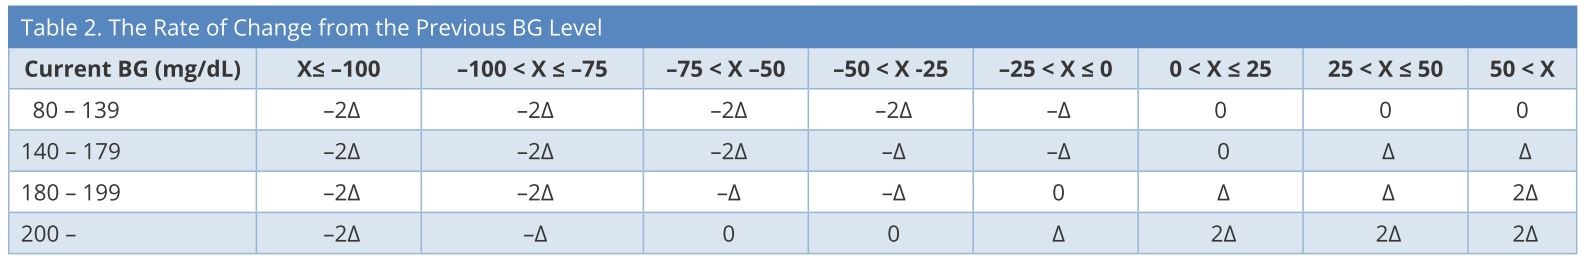
We set the target blood glucose levels as 140-180 mg/dL. First, the initial insulin infusion rate and frequency of blood glucose measurements were determined based on the current blood glucose value. Second, the insulin infusion rate was determined by subtracting the current blood glucose level from the prior value (Table 2), considering the current insulin infusion rate (Table 3). We created a simple computer program to calculate automatically and display the next insulin infusion rate using Visual Basic for Applications (VBA) of Microsoft Excel when the nurse inputs the current blood glucose and the blood glucose measurement time into a chart. If blood glucose is < 80 mg/dL, stop insulin infusion and give 16 g glucose (40% glucose / 40 ml IV), and recheck blood glucose after 15 min. If blood glucose is still < 80 mg/dL, repeat the administration of glucose. If blood glucose is ≥ 80 mg/dL, recheck blood glucose after at least 30 min. If blood glucose is still ≥ 80 mg/dL, restart infusion at -2Δ from the most recent rate.

BG, blood glucose; X = changes in BG in one hour; Δ = changes in insulin infusion rate.
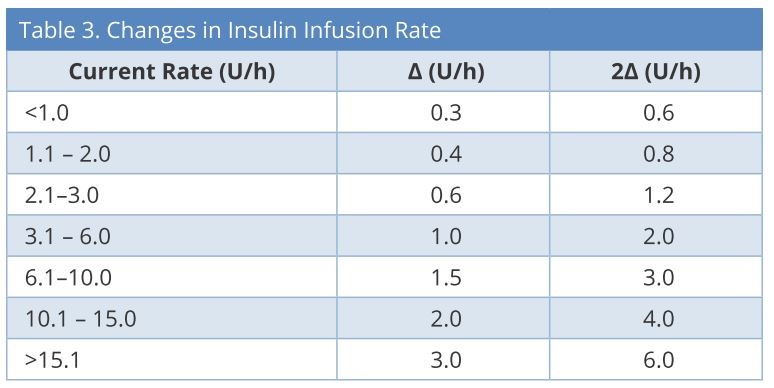
U/h: units/hour; Δ = changes in insulin infusion rate.
Data Collection
Blood glucose levels, insulin doses, and relevant clinical interventions were collected from the active hospital chart and ICU nursing records. All patients were followed up until discharge from ICU. Blood glucose levels were measured using blood gases while artery lines were inserted, and using a standard point of care glucose meter (Medisafe Fit Pro, Terumo, Japan), which measured blood glucose value by the glucose oxidase method [17], while they were not inserted. When blood glucose values were not obtained every hour, the hourly blood glucose values were calculated by averaging the known blood glucose levels from the hours before and after the missing values. Statistical analysis: Except where noted, all clinical data are expressed as mean ± SD or percentage. Baseline variables were compared using unpaired t-test. Blood glucose values and insulin infusion rate were compared between the two groups using unpaired t-test. Two tailed tests were applied to evaluate the significance and P values < 0.05 were considered statistically significant.
Study Approval
The study protocol was approved by the Ethics Committee of Keio University and conducted according to the principles of the Declaration of Helsinki.
The characteristics of the study patients are listed in Table 1. There were no significant differences between the groups in each of the parameters, except age. The age of the IP group was higher than that of the EC group (IP: 72.9 ± 7.5, EC: 66.4 ± 9.1 years). A total of 355 blood glucose values were checked until discharge from ICU in each group (IP: 10.6 ± 4.4, EC: 12.4 ± 4.3 times/patient), and there was no significant difference in the percentage of samples with values within the target blood glucose range of 140-180 mg/dL between the groups (IP: 37.7 ± 29.9, EC: 39.1 ± 22.7%). There was no case of severe hypoglycemia with blood glucose less than 60 mg/dL and no significant difference in the percentage of values in the range of 60-79 mg/dL between the groups (IP: 1.4 ± 3.9, EC: 1.9 ± 4.1%). Also, there was no significant difference in the percentage of values more than 200 mg/dL between the groups (IP: 23.2 ± 18.0, EC: 20.0 ±18.9%).
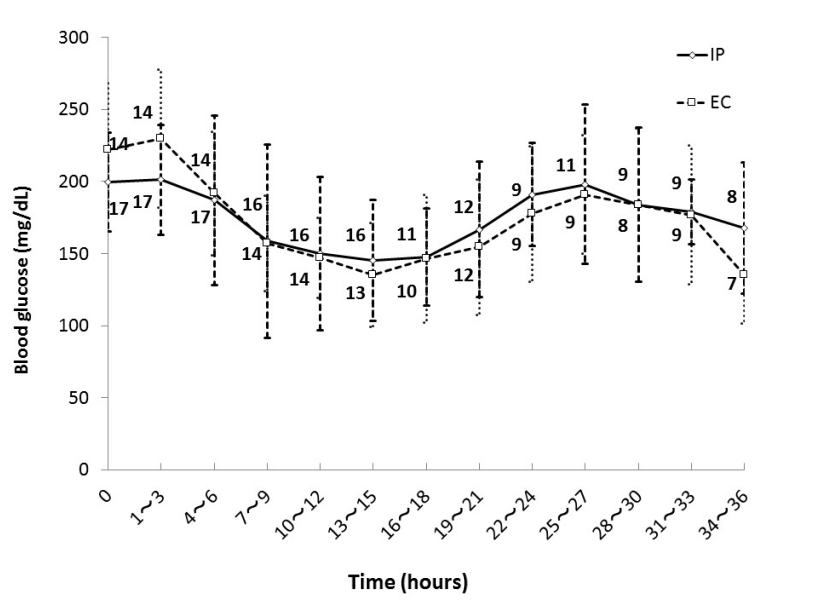
Figure 1 shows mean blood glucose level every 3 hours during the first 36 hours in each group. There were patients who left ICU within 36 hours in both groups and the numbers beside the graph represent the number of remaining patients. There was no significant difference in mean blood glucose level every 3 hours during the first 36 hours after ICU admission between the groups.
Figure 2 shows the mean insulin infusion rate every 3 hours during the first 36 hours in each group. The insulin infusion rate in the EC group was higher than that in the IP group at 10-12 and 16-18 hours after ICU admission, and there was no significant difference in insulin infusion rate except during those periods. The initial insulin infusion rate was 1.0 ± 0.7 units/hour in the IP group, and 1.4 ± 1.3 units/hour in the EC group.
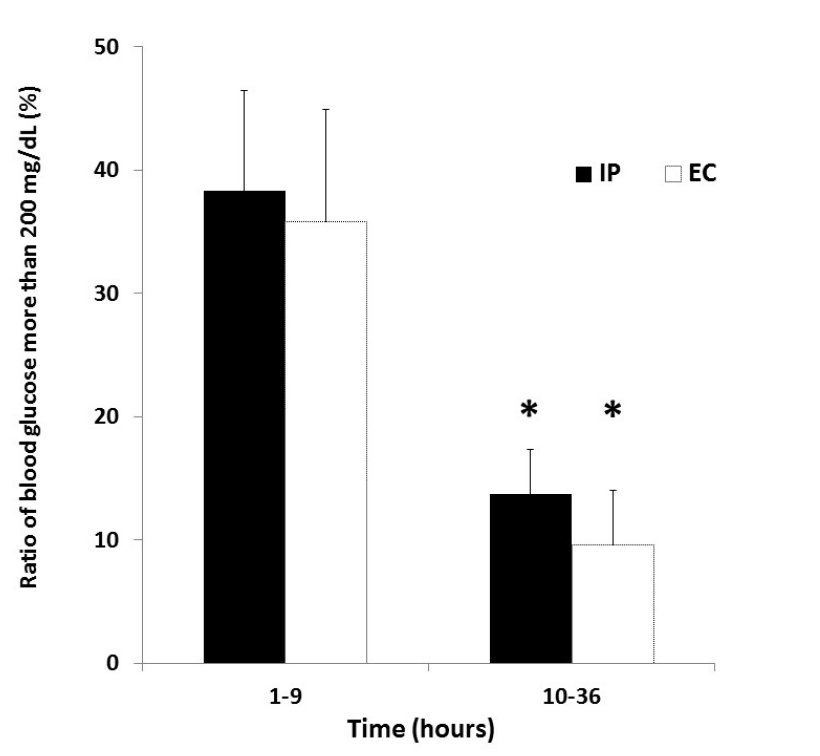
Figure 3 shows the ratio of blood glucose more than 200 mg/dL in both groups after ICU admission. The ratio of blood glucose more than 200 mg/ dL during 1-9 hours after ICU admission was 38.3 ± 33.4% in the IP group and 35.8 ± 34.0% in the EC group. The ratio of blood glucose more than 200 mg/dL during 10-36 hours after ICU admission was 13.7 ± 14.9% in the IP group and 9.6 ± 16.4% in the EC group. There were significant differences in the ratio between the two time periods in both groups (P = 0.01, P = 0.02).

Figure 1. Glycemic control in IP group and EC group. Numbers beside the graph represent the number of remaining patients. Data are mean ± S.D. Abbreviations: EC, empirical control; IP, infusion protocol.
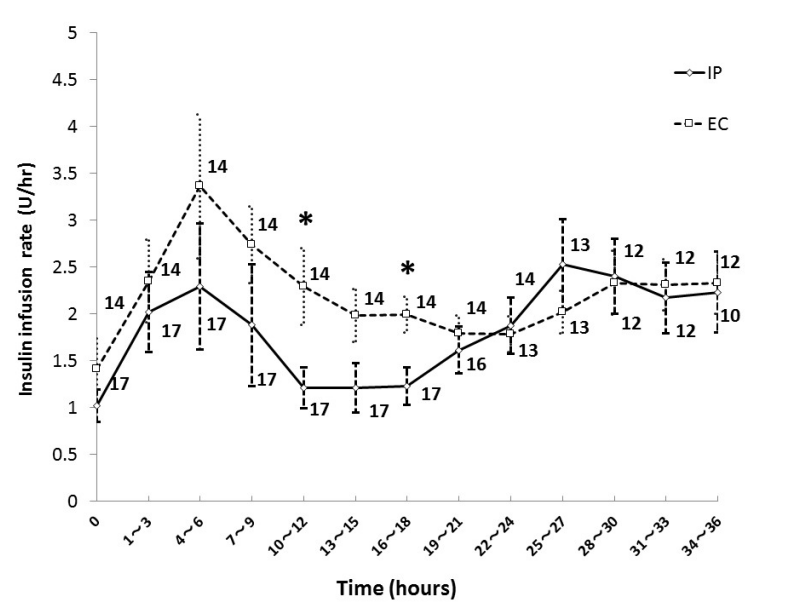
Figure 2. Insulin infusion rate in IP group and EC group. Numbers beside the graph represent the number of remaining patients. Data are mean ± S.D. *P < 0.05. Abbreviations: EC, empirical control; IP, infusion protocol.

Figure 3. Ratio of blood glucose more than 200 mg/dL in IP and EC groups after ICU admission. *P < 0.05 vs 1-9 hours after ICU admission in each group. Abbreviations: EC, empirical control; IP, infusion protocol.
We set the target blood glucose levels as 140-180 mg/dL in our IIP and verified the efficiency and safety of our protocol for Japanese patients after open-heart surgery. The Leuven Study in 2001, a single-center randomized controlled trial, showed decreased mortality associated with tight control of blood glucose levels using an intensive IIP in patients in surgical intensive care units, and improvement of several clinical outcomes [18]. In contrast, NICE-SUGAR, the largest international study comparing moderate (<10 mmol/L) versus tight (4.5–6.0 mmol/L) glycemic control using IIP in ICU patients, reported a lower incidence of hypoglycemia and lower mortality, with an IIP targeting moderate glycemic control than with tight glycemic control [11]. Findings in other studies of cardiac surgery also support the superiority of moderate glycemic control compared to tight control [12-14]. According to these results, several professional organizations revised their clinical practice guidelines [15]. The American Diabetes Association (ADA) currently recommends starting an insulin infusion in most critically ill diabetic and non-diabetic patients for persistent blood glucose levels greater than 180 mg/dL to maintain blood glucose in the range of 140 to 180 mg/dL [15]. Thus, we translated the target blood glucose level from 100-139 mg/dL in the original protocol to 140-180 mg/dL, to avoid iatrogenic hypoglycemia.
We examined the appropriateness of our IIP, in which the delta rate changes of insulin infusion were much reduced compared to those in the original Yale IIP, to fit Japanese patients, who were less obese and less insulin resistant. There were no significant differences in the percentages of achieved target blood glucose between the IP group and EC group, and the frequency of hypoglycemia and glucose every 3 hours during the first 36 hours after ICU admission were also statistically equivalent. These results show that our IIP could equally control blood glucose levels in patients who have undergone open-heart surgery as compared with the previous empirical therapy, suggesting that our protocol is useful for efficient blood glucose management of Japanese patients. Compared with the Yale IIP, our protocol reduced the insulin infusion dosage for Japanese patients to avoid hypoglycemia. In fact, our protocol prevented hypoglycemia as much as the empirical therapy would have; this confirmed the safety of our protocol, owing to the effect of incidence of hypoglycemia on the prognosis of patients.
One purpose of our simplified computer-programmed IIP was to reduce the burden of ICU nurses because manual calculation to determine the next insulin dose based on blood glucose changes is too complicated and confusing. Actually, our IIP did not have any problem with the determination of the insulin infusion rate by ICU nurses in clinical practice.
In both groups, the ratio of blood glucose more than 200 mg/dL during 1-9 hours after ICU admission was significantly higher than that during 10-36 hours. This result indicates that we need to improve initial blood glucose control after ICU admission. In this study, the initial insulin infusion rate was 1.0 ± 0.7 units/hour in the IP group and 1.4 ± 1.3 units/ hour in the EC group. Compared with another report in Japan, although it was difficult to make a simple comparison because the target blood glucose was different, our initial insulin infusion rate was lower and blood glucose measurements were less frequent [8]. In view of these results, we need to consider increasing the initial insulin infusion rate and the frequency of blood glucose measurements depending on the patient status, with the aim of more effectively controlling blood glucose in the early phase after ICU admission.
This study has several limitations. First, the frequency of blood glucose measurements was not unified and it was decided by each attending doctor depending on the condition of the patient. Second, our study was a retrospective study and not a randomized control study. This implies that certain biases are involved in this study. This study was started as a clinical project to construct a simpler and safer IIP with less burden. We evaluated its validity by comparing with the historical control of the former empirical method and we achieved the initial purpose of the project. Meanwhile, few studies have investigated the efficiency and safety of insulin infusion protocols or an artificial endocrine pancreas with a closed-loop glycemic control system in Asians [19]. We hope this study will contribute to the safer and more effective blood glucose control in Japanese and Asian patients with acute critical illness.
We examined the appropriateness of an IIP, which was modified to fit the Japanese population, who were usually less obese and less insulin-resistant. This IIP maintained blood glucose levels within the target range in patients who underwent open-heart surgery as equally well as the previous empirical therapy. These findings confirm the efficiency and safety of our IIP with less burden in blood glucose management of Japanese patients.
Received date: December 27, 2017
Accepted date: January 23, 2018
Published date: April 02, 2018
None
None
The authors thank Tomoko Okumura (Division of Hospital Information on Systems, Keio University School of Medicine) and the Division of Patient Safety, Keio University Hospital for expert technical assistance.
© 2018 The Author(s). This is an open-access article distributed under the terms of the Creative Commons Attribution 4.0 International License (CC-BY).


Diabetes control in the studied population could be too strict, and consequently, hypoglycemia in these patients could play a role in the major decline of cognitive function. Therefore, avoiding treatments that could lead to hypoglycemia in these patients could be very important. The aim of the treatment of diabetes in elderly patients is focused on stabilization, prevention of acute complications, and improving the quality of life.
A paradigm shift in type 2 diabetes may contribute to the reinforcement of new research questions and further improvement of diabetes care in clinical practice.
Authors report a young girl with an HNF1β mutation, who had a history of neonatal cholestasis, persistent liver dysfunction, and developed insulin-dependent diabetes without renal involvement. Further, authors review the literature related to the hepatic involvement associated with HNF1β mutations.
A healthy lifestyle includes appropriate caloric intake, reduced intake of saturated fat and sugar-containing snacks and beverages, increased intake of vegetables and unsaturated fat, an increase in physical activity, and possibly avoiding even a small amount of alcohol intake.
A higher titer of IA-2Ab reflects a reduced pancreatic size in the patients with Type 1 diabetes (T1D), especially in those with the acute-onset form of the disease. The potential mechanisms underlying the reduced pancreatic size might differ between acute-onset T1D and slowly progressive insulin-dependent diabetes mellitus. The authors investigated the relationship between islet autoimmunity and pancreatic size in the Japanese patients with T1D.
A higher titer of IA-2Ab reflects a reduced pancreatic size in the patients with Type 1 diabetes (T1D), especially in those with the acute-onset form of the disease. The potential mechanisms underlying the reduced pancreatic size might differ between acute-onset T1D and slowly progressive insulin-dependent diabetes mellitus. The authors investigated the relationship between islet autoimmunity and pancreatic size in the Japanese patients with T1D.
In this manuscript, the authors have provided a novel efficient, safe, and less complicated insulin infusion protocol, which was based on a simple computer-program, for Japanese patients after open-heart surgery. The study is well designed, and the authors’ conclusions are appropriate for the results obtained. I have only a few suggestions which would make the article more sophisticated.
Inaishi J, Meguro S, Itoh A, Saisho Y, Irie J, Tanaka M, Kawai T, Hirano A, Kudo M, Shimizu H, Itoh H. Efficiency and safety of new insulin infusion protocol for Japanese patients after open-heart surgery. Diabetes Endocrinol 2018;1(1):4. https://doi.org/10.24983/scitemed.de.2018.00055
 PDF
PDF