Objective: The use of bone wax to plug a dehiscent superior semicircular canal has been found to be associated with poorer hearing outcomes in humans when compared with the use of bone. Animal models showed that plugging the superior or lateral semicircular canal with bone wax caused an inflammatory reaction in the middle ear that was significantly more severe than with bone or Teflon. Damage to the cochlea can lead to alterations in the size, number and density of the spiral ganglion neurons. This study aims to examine potential cochlear damage caused by plugging a dehiscent superior semicircular canal with different materials in gerbils by analyzing the spiral ganglion of the basal cochlear turn.
Methods: We used hematoxylin and eosin-stained mid-modiolar paraffin sections from 44 operated ears and 19 non-operated control ears to examine spiral ganglion structures in cochlear cross-sections through the lower basal turn and upper basal turn. We calculated the number of spiral ganglion cells and measured their size. We also measured the area of the Rosenthal's canal and assessed the density of neurons within it. Furthermore, the degree of interstitial edema within the spiral ganglion was assessed.
Results: For most of the plugging materials, the main pathological finding following surgery was a loss of spiral ganglion cells predominantly in the lower basal turn. No evidence was found for a shrinkage of spiral ganglion cells or a reduction in spiral ganglion cell density as a result of plugging the superior semicircular canal.
Conclusion: The spiral ganglion appears to be more severely damaged in the lower basal turn compared to the upper basal turn for the majority of materials used for plugging a dehiscent superior semicircular canal.
Dehiscence of the superior semicircular canal is an incapacitating disease that results in sound- or pressure-induced vestibular symptoms and can be accompanied by autophony and conductive hearing loss [1]. The plugging of the superior semicircular canal has been demonstrated to be an effective treatment, and various materials (e.g., fascia, bone, and bone wax) can be employed in clinical practice [2]. According to histological analysis using a gerbil model, distinct differences were observed in the tissue reactions of materials placed in the middle ear and the superior semicircular canal eight weeks after the superior semicircular canal had been surgically opened and plugged with Teflon, bone wax, fat, muscle, and bone [3]. The adverse tissue reactions of bone wax plugs in the middle ear and superior semicircular canal were the most noticeable in virtually all of these materials. Furthermore, bone wax plugs have been associated with poorer hearing outcomes compared to bone in both humans [4,5] and animals [6].
Based on these observations, we hypothesized that the cochlea of ears with bone wax plugs would appear to be more damaged than those with bone, muscle or Teflon plugs. In this regard, this may be reflected either in the loss of, shrinkage of, or diminished density of spiral ganglion neurons [7-13]. Moreover, the superior semicircular canal is located adjacent to the cochlear base, which makes plugging of a dehiscent superior semicircular canal more likely to result in damage to the cochlear base than to its apical regions. Thus, we evaluated the number, size, and density of spiral ganglion neurons in mid-modiolar cochlear sections of gerbils, in which the superior semicircular canal had been surgically opened and subsequently plugged.
This study aimed to identify and characterize the potential cochlear trauma caused by plugging, to compare the effects of different materials on plugging, and to assess separately the extent of potential damage in the lower basal turn (which is located closer to the plugging site) as well as the upper basal turn (which is located farther from the plugging site).
A total of 54 young (6-8 weeks old) male gerbils weighing between 50 and 80 grams were obtained from Charles River (Sulzfeld). At the time of surgery, the mean age of the gerbils was 10.2 ± 1.6 weeks, and the mean weight was 76.5 ± 7.7 grams.
The gerbils were anesthetized with intraperitoneal injections of xylazine (6-8 mg/kg of body weight) and ketamine (90-120 mg/kg of body weight). A local anesthetic was then injected into the right post-auricular area (Xylonest 1% with Adrenaline 1:200,000; AstraZeneca) for pain control and bleeding control. Under aseptic conditions, the surgery was performed at 37°C using appropriately sterilized instruments and materials. A 10-15 mm incision was made in the dorso-ventral direction in the skin and muscle layer behind the outer ear in order to gain access to the bony wall of the gerbil bulla located in the region of the dorsal and ventral mastoid cavities (for a description and nomenclature of the gerbil bulla subdivisions, see [14]; for an anatomical overview, see Figure 1A). The bulla was exposed by creating a lid of approximately 3 mm in diameter to gain access to the superior semicircular canal. With the aid of 45-degree hooks and perforators, the bony wall of the superior semicircular canal was opened across its entire width over an approximate distance of 0.5 mm along the canal. In the canal that had been opened, plugging material was introduced at both ends. After visual verification of a successful blockage of the canal, the bony lid was repositioned and the opening of the bony wall of the dorsal mastoid cavity was sealed. Three to four stitches were used to close the subcutaneous muscle layer using monofilament polyamide suture thread. In the following step, the skin incision was closed with four to five stitches of absorbable suture thread.

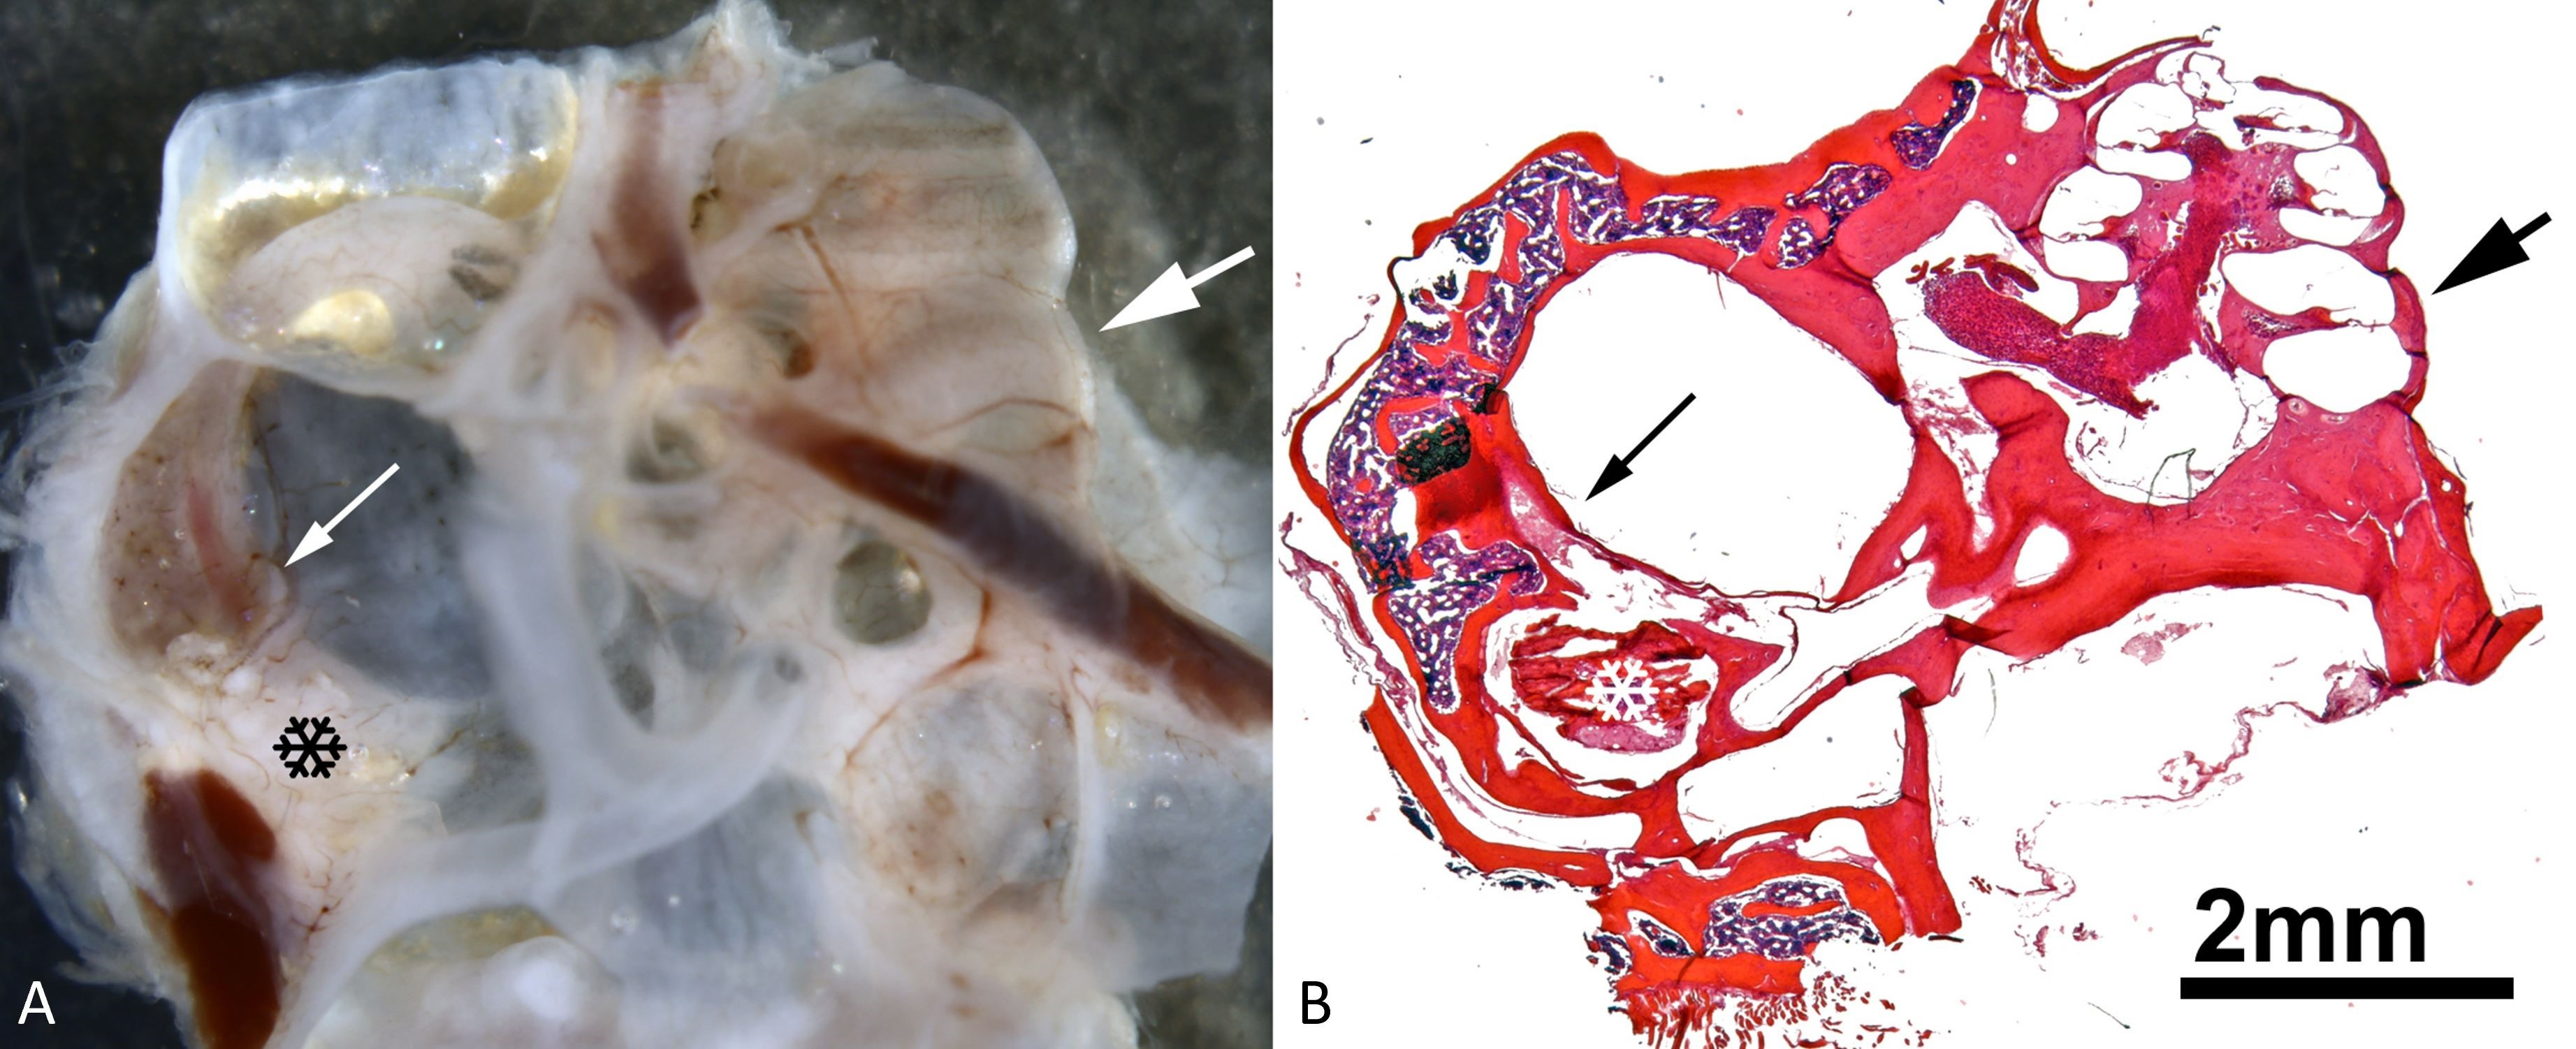
Figure 1. An illustration of the spatial relationship between the plugged region of the superior semicircular canal and the cochlea. (A) A whole mount of the dissected right ear and a view into the dorsal mastoid cavity (for nomenclature, see [18]). Notice the semicircular canals on the left-hand side, as well as the cochlea on the right-hand side. The thin white arrow in the left half indicates the superior semicircular canal within the dorsal mastoid cavity that lies slightly dorsal to the surgically induced dehiscence that was plugged with bone wax. The black snowflake represents inflammation-induced tissue growth within the dorsal mastoid cavity. A thick white arrow in the right half of the image points to the region of the lower basal cochlear turn. (B) A low-power micrograph of an appropriately oriented mid-modiolar cochlear paraffin section taken from the whole mount depicted in panel A. The thin black arrow on the left indicates the superior semicircular canal within the dorsal mastoid cavity that lies slightly dorsal to a surgically induced dehiscence that has been plugged with bone wax. The white snowflake represents inflammation-induced tissue growth in the dorsal mastoid cavity. In the right half of the image, there is a thick black arrow pointing to the lower basal cochlear turn.
Eight weeks following surgery, the gerbils were killed, and their inner ears were harvested for histological analysis. Using hematoxylin and eosin-stained paraffin sections of 10 µm thickness (Figure 1B), we examined 44 right ears of 54 gerbils. These ears had the superior semicircular canal plugged with Teflon (n = 7, Goretex sutures 0.2 mm), bone wax (n = 13), bone paté (n = 12), muscle (n = 6), and fat (n = 6). A total of 19 non-operated left ears were used as controls as well.
After examining the mid-modiolar sections of the cochlea (Figures 1B, 2A), we analyzed the cross-sections of the ganglions (Figures 2B-C) in the lower basal turn (which corresponds to approximately the 35 kHz region) and the upper basal turn (which corresponds to approximately the 10 kHz region), respectively [15]. Two mid-modiolar sections from each individual cochlea were analyzed. The sections were placed 50-100 µm apart in order to avoid the possibility of multiple counts of cells that intersected in adjacent sections.
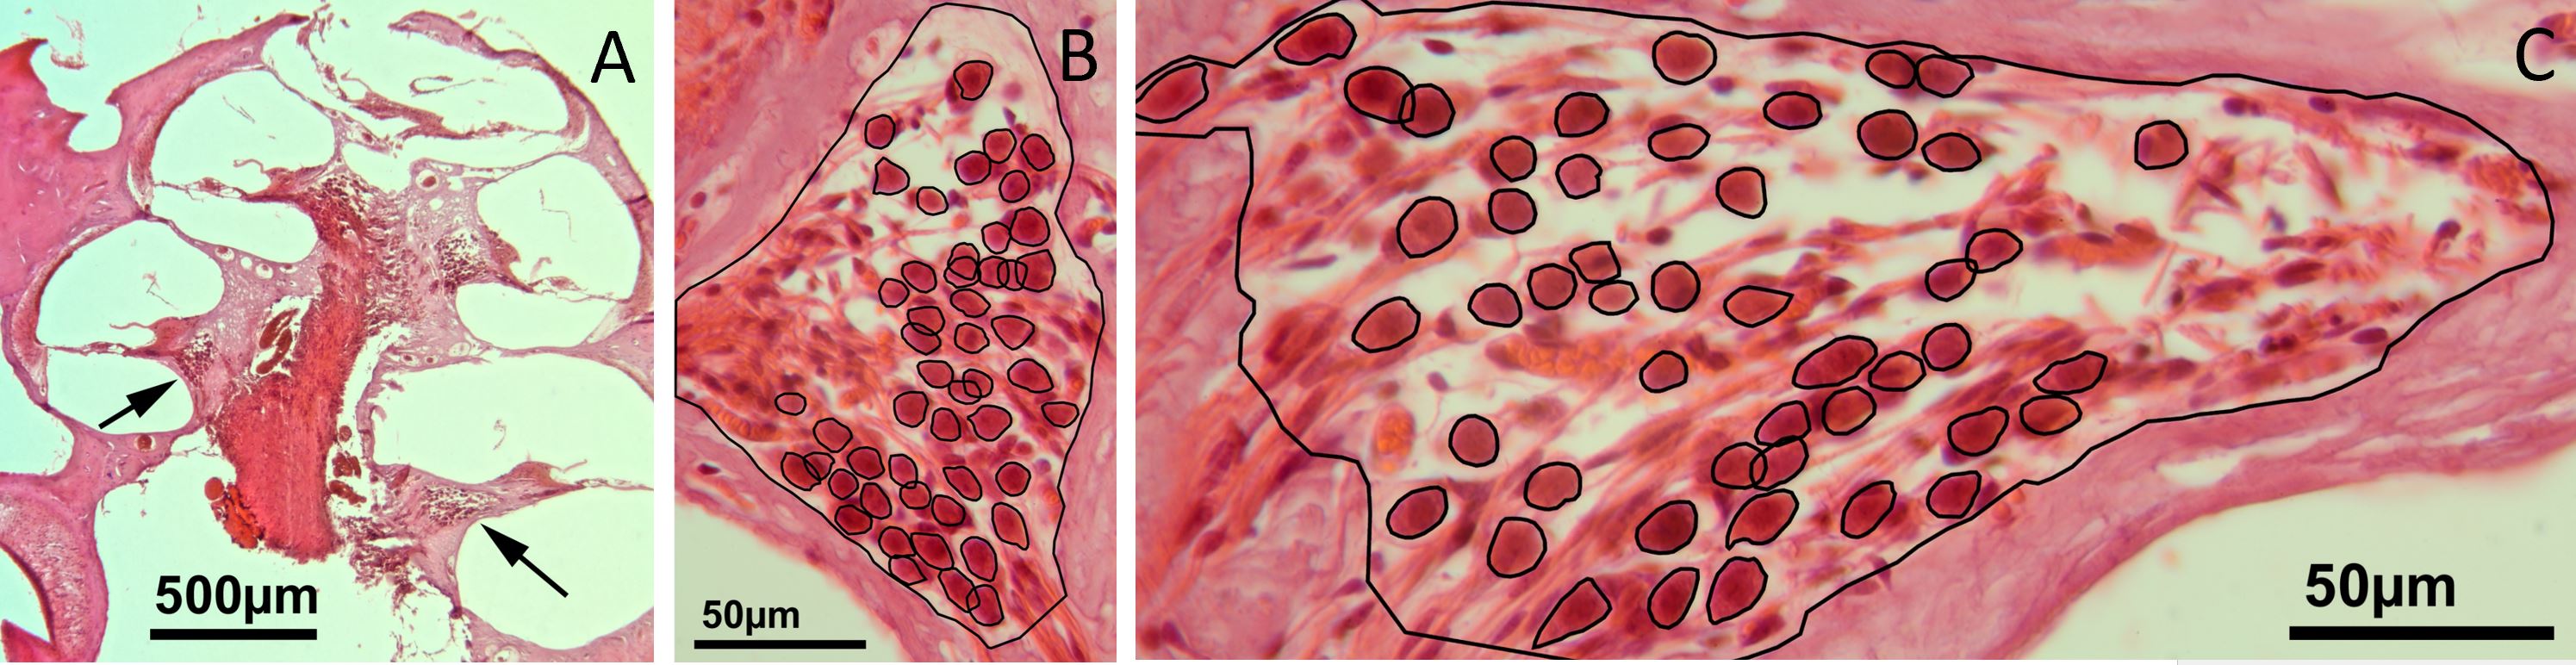
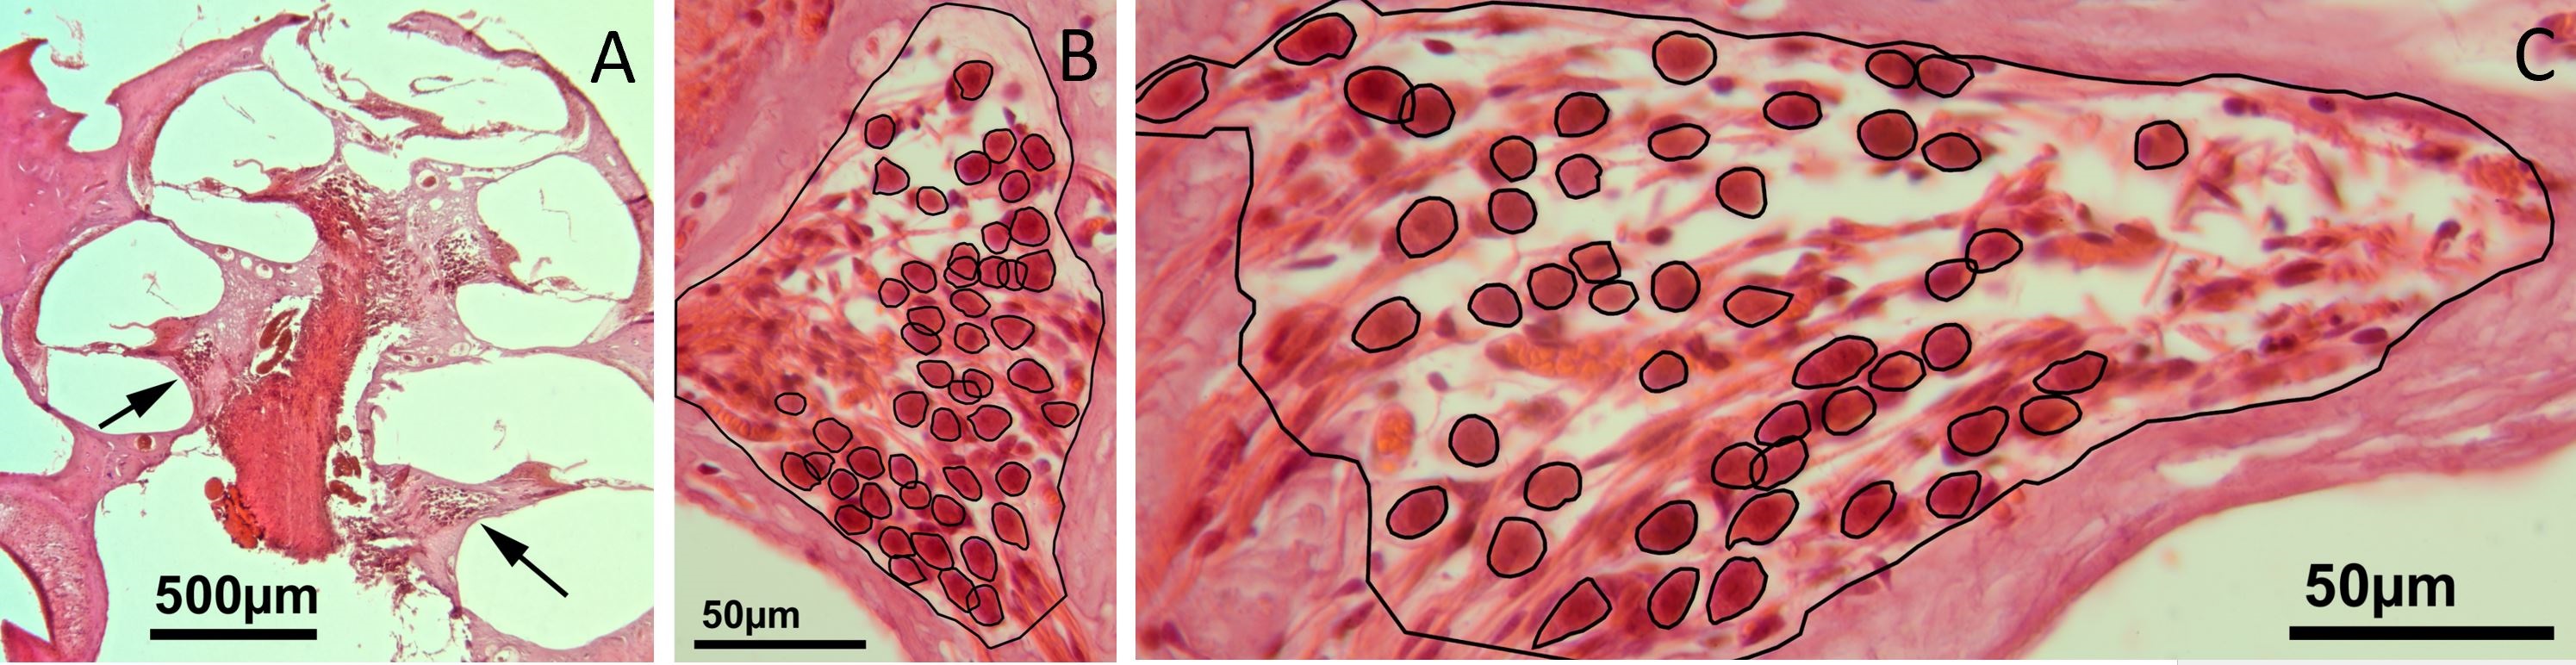
Figure 2. (A) A low-power micrograph of a mid-modiolar section through the right cochlea of a gerbil, eight weeks after bone wax has been plugged into the superior semicircular canal. The arrows within the scala tympani point towards the spiral ganglions of the lower basal turn on the right and the upper basal turn on the left. (B) A high-power image of the spiral ganglion cross-section of the upper basal turn. (C) A high-power image showing a cross-section of the spiral ganglion of the lower basal turn. An overlay of black lines shows manually drawn regions of interest that represent the outline of auditory neurons and the border of the Rosenthal's canal (for details, please refer to the method text).
The images were digitized using a Canon EOS 60D camera mounted on a Laborlux microscope, which was equipped with a 40x lens (Leitz PL Fluotar 40/0.7, providing a nominal resolution of 26.5 pixels/µm). A stack of 20 images (each approximately 0.5 µm apart) was digitally scanned along the z-axis between the top and bottom surfaces of each paraffin section in order to clearly discern the cell boundaries within the 10 µm thick paraffin sections. Stacks of the resulting images were analyzed with ImageJ 1.47. Among these stacks, only spiral ganglion neurons with a normal appearance of the nucleus were selected for cell counting and measurement of the cross-sectional soma area. The region of interest was manually drawn (using the polygon function in ImageJ) around each neuron at the z-level, where the cell boundaries appeared well defined, and the nuclei appeared to be the largest. As illustrated in Figure 2, regions of interest are indicated around spiral ganglion neurons and Rosenthal's canal. Each set of regions of interest was stored separately for each image stack. We calculated the areas of the region of interest (spiral ganglion neurons and Rosenthal's canal) using the measure function in ImageJ and transferred these data into Microsoft Excel 2016 for final analysis and calibration. The density of spiral ganglion neurons was determined by the ratio of the number of cells to the cross-sectional area of Rosenthal's canal.
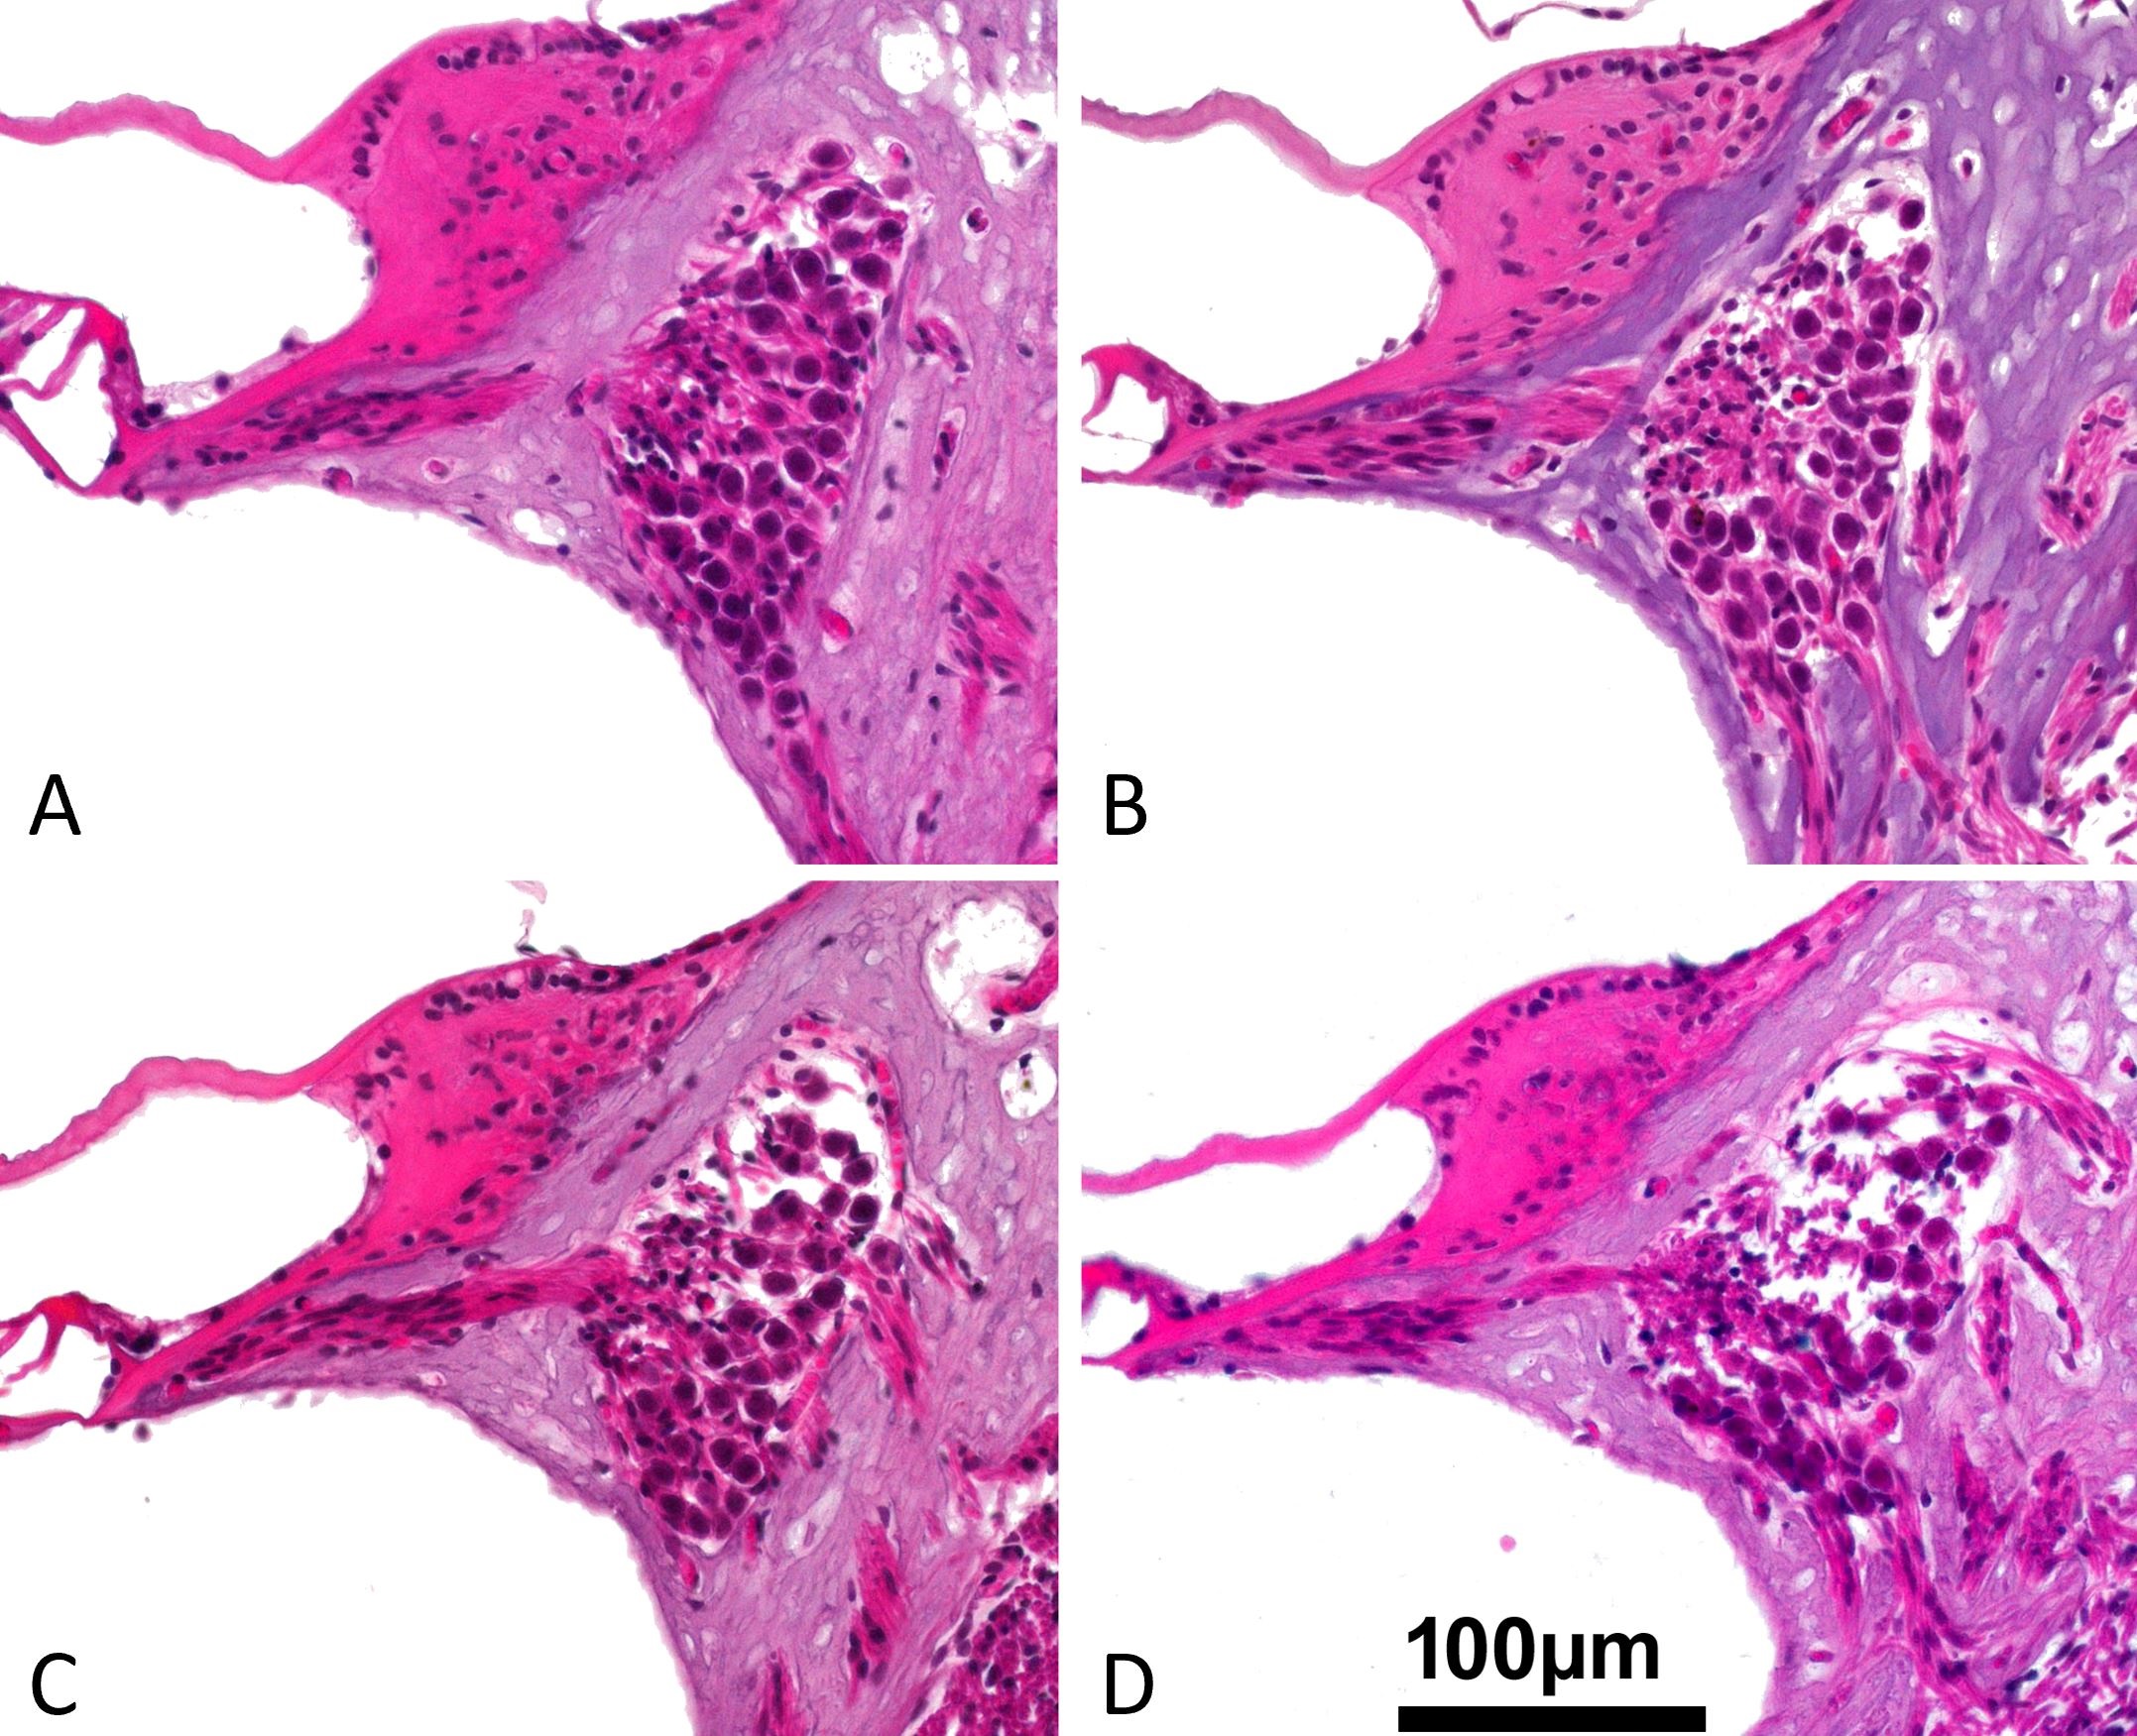
It was noteworthy that there was evidence of interstitial edema in certain sections of the spiral ganglion, which did not correspond to the quantitative measurements of the number, size, and density of neurons. Accordingly, we attempted a semi-quantitative classification of the degree of interstitial edema in spiral ganglion based on an analogue scale (0 was for none, 1 was for low, 2 was for medium, and 3 was for high), by evaluating the extent of empty intercellular space (without stained structures), as illustrated in the representative examples from the upper basal turn in Figure 3.

Figure 3. These cross-sectional pictures are representative examples of the upper basal turn spiral ganglion for the classification of the intercellular edema after the superior semicircular canal has been plugged with a variety of materials. (A) Gradient 0: no edema (Teflon). (B) Grade 1: low grade edema (bone wax). (C) Grade 2: medium grade edema (fat). (D) Grade 3: high grade edema (muscle). An intercellular edema is characterized by the presence of empty, non-structured areas around the neurons (primarily in the dorsal portion of the spiral ganglion).
A statistical analysis of the data was conducted using SPSS for Windows (IBM SPSS Statistics 25). A Wilcoxon signed rank test was used for comparing two paired samples obtained from the lower basal turn and the upper basal turn of individual cochleae with respect to cell number, cell size, cross-sectional area of Rosenthal's canal, cell density, and interstitial edema (refer to the P values above the corresponding columns of Figures 4-8). We analyzed six groups (one non-operated control group and five groups in which the superior semicircular canal was plugged with various materials) using a Kruskal Wallis test (see P values below the horizontal axis in Figures 4-8) to determine the significance of the differences between treatments. When the Kruskal Wallis Test indicated a significant effect of treatment, pairwise comparisons using the Mann Whitney U Test were carried out to determine whether significant differences between groups existed (refer to horizontal double arrows in Figures 4-8). In this study, we used a P value of 0.05 as our significance threshold.
In all the ears with Teflon, bone wax, or bone paté/chips, a complete closure of the superior semicircular canal was achieved. However, only 50% or fewer of the ears with fat and muscle were able to achieve a complete closure of the superior semicircular canal [3]. In each of the 63 cochleae analyzed in the present study, the number and cross-sectional area of spiral ganglion neurons as well as the cross-sectional area of Rosenthal's canal were measured in two mid-modiolar cross-sections at the lower and upper basal turns (Figure 2) in order to identify frequency related gradients in the spiral ganglions, which led to the identification of 147-265 spiral ganglion neurons per ear.
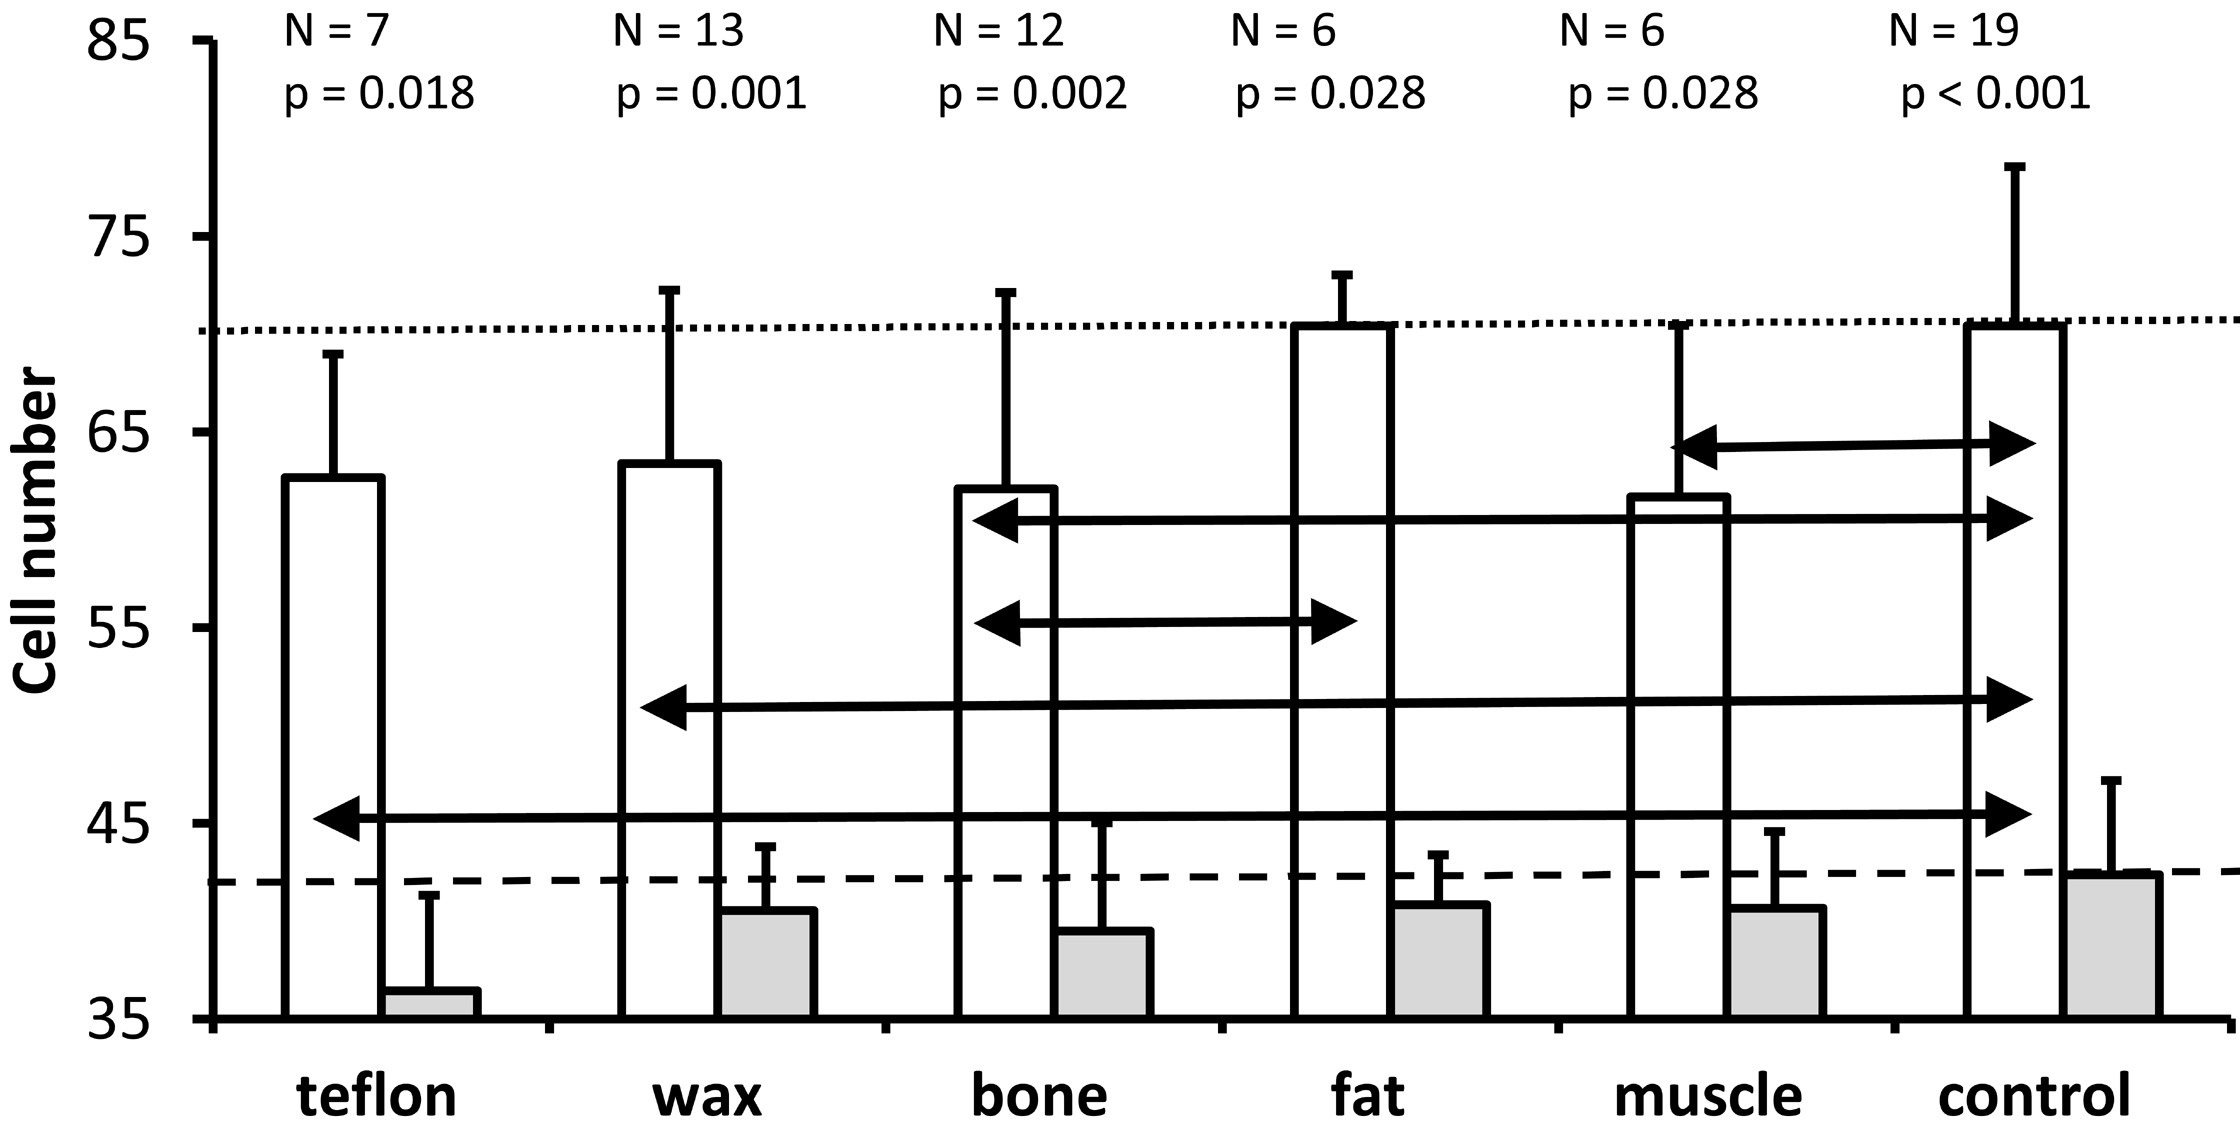
Cell Number
As depicted in Figure 4, the Wilcoxon test demonstrated that significantly more cells were present in the lower basal turn (white bars) than in the upper basal turn (gray bars) in all five materials and in the control group. Further Kruskal Wallis tests indicated that treatment significantly affected cell number in the lower basal turn (P = 0.039), but not in the upper basal turn (P = 0.304). The Mann Whitney U tests were used for the lower basal turn to identify statistically significant differences between treatment groups, as indicated by the horizontal double arrows in Figure 4. In comparison with controls (mean = 70.4 cells), the number of cells at the lower basal turn was significantly lower for Teflon group (mean = 62.6, P = 0.041), wax group (mean = 63.4, P = 0.033), muscle group (mean = 61.7, P = 0.043) and bone group (mean = 62.1, P = 0.039) but not for fat group (mean = 70.4, P = 0.733). Compared to the fat group, the bone group exhibited significantly fewer cells (P = 0.024). None of the other comparisons were statistically significant. However, the significance criterion (P ≤0.05) was just missed when comparing Teflon with fat (P = 0.051) and fat with muscle (P = 0.065). Based on the data of Figure 4, the results suggest that plugging the superior semicircular canal in gerbils was closely associated with a significant loss of spiral ganglion neurons in the lower basal turn, but not in the upper basal turn.

Figure 4. An illustration of the mean and standard deviation of the number of spiral ganglion neurons in the lower basal turn (white bars) and the upper basal turn (gray bars) for all groups. In both the control group and the treatment groups, the number of cells in the lower basal turn is significantly higher than those in the upper basal turn (Wilcoxon test; P values above each pair of bars). A comparison of all groups (Kruskal Wallis test) reveals that treatment has a significant effect on the number of spiral ganglion neurons for the lower basal turn (P = 0.039), but not for the upper basal turn (P = 0.304). The horizontal black double arrows illustrate significant differences between treatment groups for the lower basal turn (Mann Whitney U test). The horizontal dotted line indicates the mean cell number for the lower basal turn of the non-operated control ears. The dashed line indicates the mean number of cells obtained from the non-operated control ears in the upper basal turn.
Cell Size
As shown in Figure 5, the cell size in each of the treatment groups was on average greater in the lower basal turn than in the upper basal turn. Above each pair of bars, the number of ears analyzed and the Wilcoxon-test P value for the comparison between the cell sizes derived from the lower basal turn and the upper basal turn are provided.
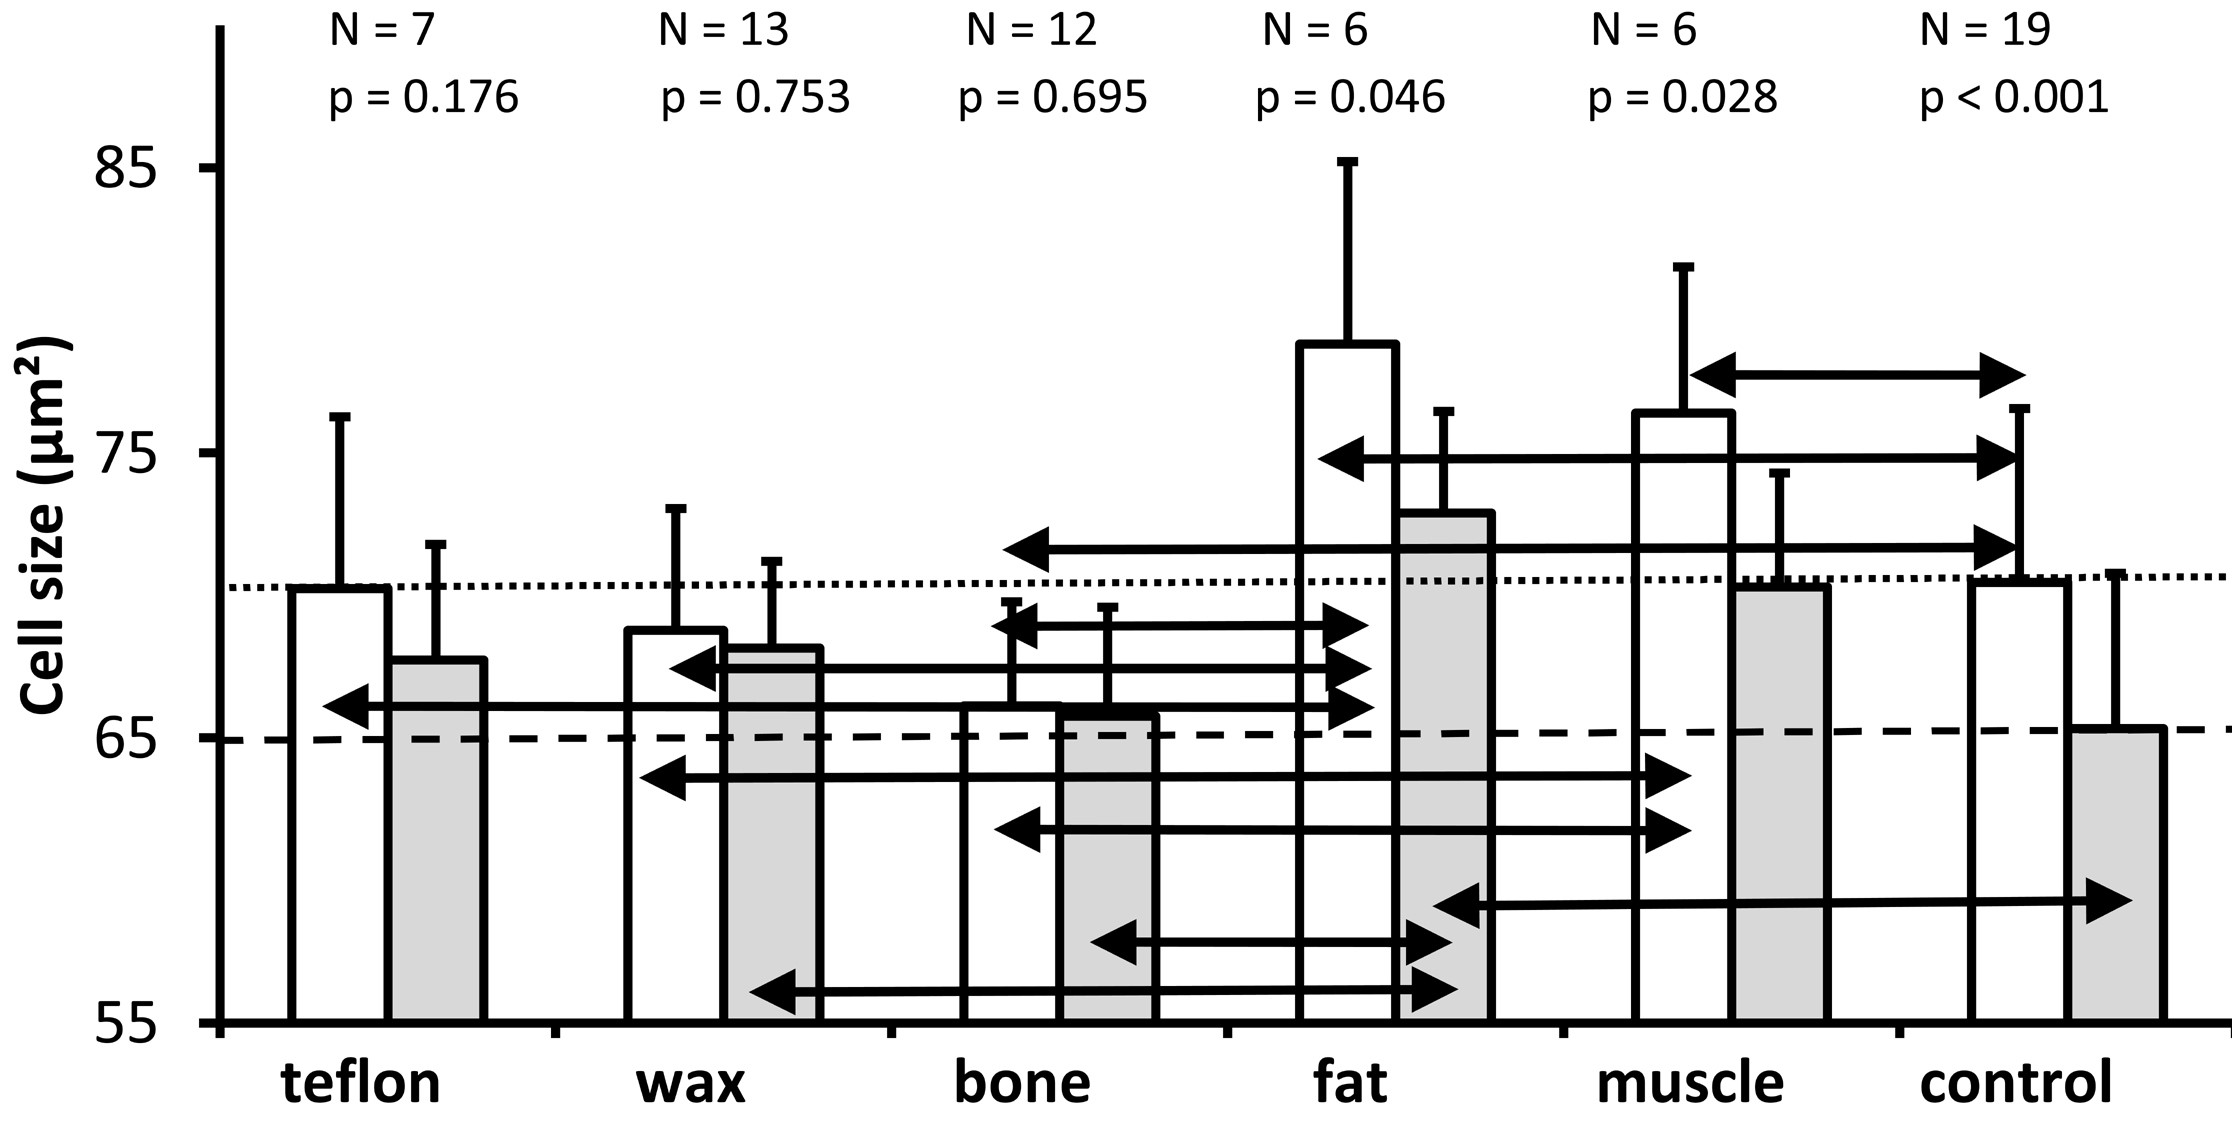
Figure 5. A graph depicting the mean and standard deviations of the cross-sectional area of spiral ganglion neurons (mean of the cells analyzed in the two mid-modiolar sections from each ear) for the lower basal turn (white bars) and the upper basal turn (gray bars) in the groups in which the superior semicircular canal was plugged with different materials as well as in the non-operated control group. As it is indicated above each pair of bars for the different treatment groups, the number of ears analyzed and the P value (Wilcoxon test) for comparison of the cell size between the lower basal turn and the upper basal turn for each group are presented. The horizontal dotted line represents the mean cell size of the lower basal turn of the control group. The horizontal dashed line represents the mean cell size of the upper basal turn of the non-operated control ears. A Kruskal Wallis comparison of all groups reveals a significant effect of treatment on the cross-sectional area of spiral ganglion neurons in the lower basal turn (P = 0.003) and in the upper basal turn (P = 0.025); the black double arrows indicate significant differences between treatment groups for both the lower and upper basal turns (Mann Whitney U test, P ≤0.05).
A Wilcoxon-test identified significantly larger cells in the lower basal turn than in the upper basal turn in the fat group (P = 0.046), muscle group (P = 0.028), and control group (P <0.001), but not the Teflon group (P = 0.176), the wax group (P = 0.753), or the bone group (P = 0.695). The horizontal dotted line represents the mean cell size of the lower basal turn, while the dashed line represents the mean cell size of the upper basal turn of the non-operated control ears.
We performed the Kruskal Wallis test on all groups and found statistically significant differences between the plugged and control groups regarding the cross-sectional area of spiral ganglion neurons in the lower (P = 0.003) and upper (P = 0.025) basal turns.
Pairwise comparisons (Mann Whitney U) for the lower basal turn revealed that compared with controls (mean = 70.5 µm²), cell size was significantly larger in the fat group (mean = 78.8 µm², P = 0.030) and muscle group (mean = 76.4 µm², P = 0.05); significantly smaller in the bone group (mean = 66.1 µm², P = 0.028); and not significantly different in the Teflon group (mean = 70.2 µm², P = 0.977) and wax group (mean = 68.8 µm², P = 0.383).
For the lower basal turn, a comparison of plugging materials showed significantly larger cells in ears plugged with fat versus Teflon (P = 0.035), wax (P = 0.009), and bone (P = 0.005); as well as significantly larger cells in ears plugged with muscle versus wax (P = 0.009) and bone (P = 0.001); while the difference in cell size between muscle and Teflon (P = 0.073), and for all other pairwise comparisons (P >0.05), was not significant.
The cell size of the upper basal turn was significantly larger in the fat group (mean = 72.9 µm²), when compared to the control group (mean = 65.3 µm², P = 0.007). There was just a marginal difference between the muscle group and the control group (mean = 70.3 µm², P = 0.059). The other pairwise comparisons of the materials (mean size of Teflon 67.7 µm², wax 68.2 µm², and bone 65.8 µm²) with the control indicated no statistically significant differences (P >0.05).
A comparison of the plugging materials showed that the cells in the fat group were significantly larger than those in the wax group (P = 0.022) and those in the bone group (P = 0.007) at the upper basal turn. The difference in cell size between muscle and bone groups missed significance (P = 0.067), and all other pairwise comparisons between materials were not significant (P >0.05).
Based on the results of the study, cell size varied considerably between experimental conditions for the lower basal turn and upper basal turn. There is no evidence of trauma-induced shrinkage of spiral ganglion neurons observed in those ears which had been plugged compared to those ears which had not been plugged. The plugging of the superior semicircular canal with fat, or to a lesser extent with muscle, may result in a slight increase in the cross-sectional area of the spiral ganglion neurons.
Rosenthal's Canal
In both the control group and the five plugged groups, Rosenthal's canal area was found to be significantly larger in the lower basal turn than in the upper basal turn (P <0.05, Figure 6). The P values for Wilcoxon tests comparing the lower and upper basal turns are shown above the respective bars.
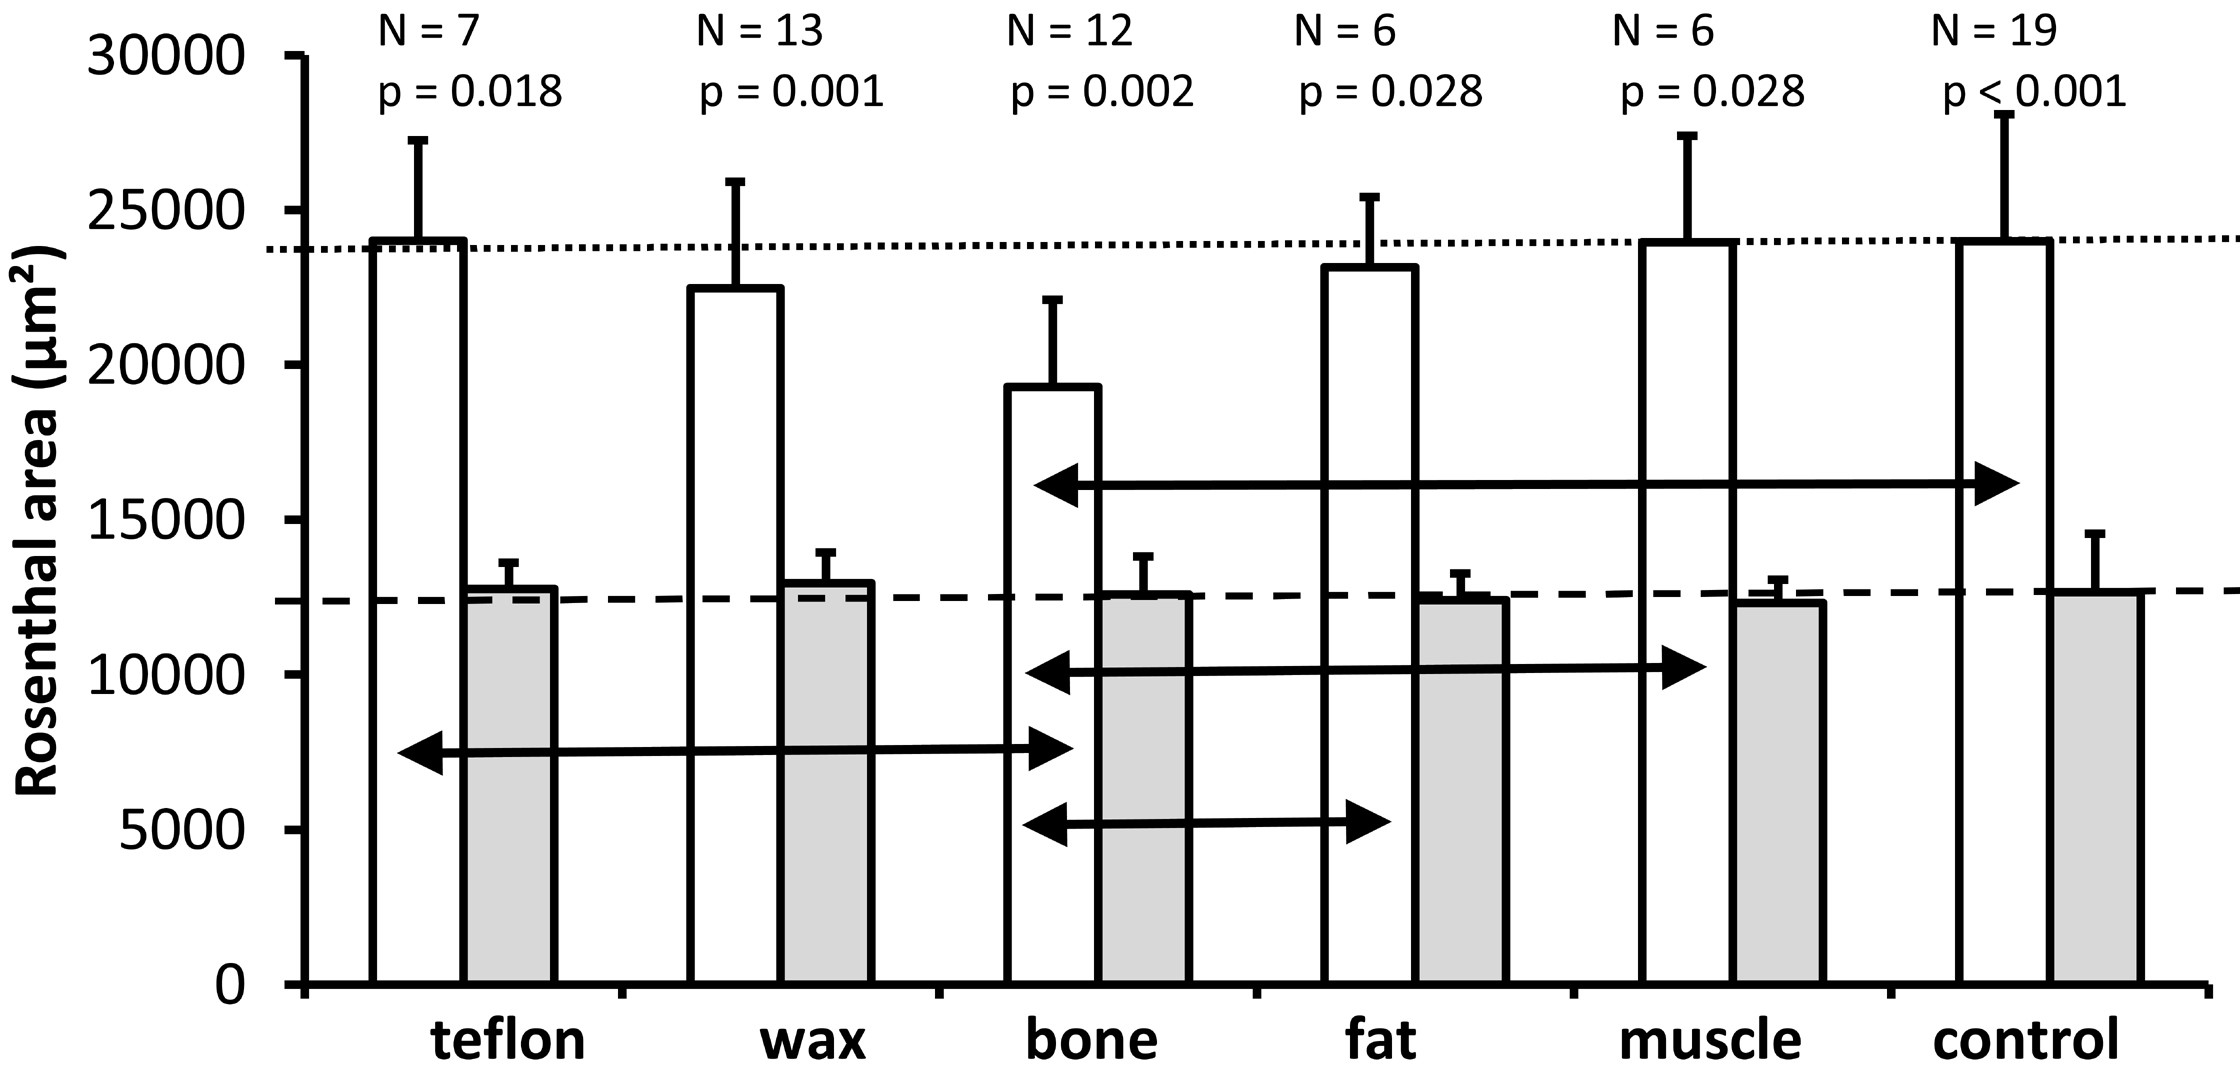
Figure 6. A graph illustrating the mean and standard deviation of the cross-sectional area of Rosenthal's canal (mean of two mid-modiolar sections from each ear) for the lower basal turn (white bars) and the upper basal turn (gray bars) for all experimental groups. As it is indicated above each pair of bars for the different treatment groups, the number of ears analyzed and the Wilcoxon P values are provided for comparison of Rosenthal's canal between the lower and upper basal turns. The horizontal dotted line indicates the mean cross-sectional area of Rosenthal's canal for the lower basal turn in the control group. The horizontal dashed line represents the mean cross-sectional area of Rosenthal's canal for the upper basal turn in the control group. The Kruskal Wallis tests indicate a significant effect of treatment on the cross-sectional area of Rosenthal's canal in the lower basal turn (P = 0.010) but not in the upper basal turn (P = 0.819). The black horizontal double arrows indicate significant differences between treatment groups in the lower basal turn (Mann Whitney U test, P ≤0.05).
The analysis of the 6 groups (Kruskal Wallis test) revealed a significant effect of treatment on the cross-sectional area of Rosenthal's canal only for the lower basal turn (P = 0.010), but not for the upper basal turn (P = 0.819). A further analysis of pairwise comparisons (Mann Whitney U Test) of the lower basal turn (double arrows in Figure 6) revealed that the bone group (mean = 19282 µm²) had a significantly smaller cross-sectional area of Rosenthal's canal compared with the control group (mean = 23984 µm², P <0.001), fat (mean = 23148 µm², P = 0.024), muscle (mean = 23958 µm², P = 0.005) and Teflon (mean = 24004 µm², P =0.010). The difference between the bone and wax groups failed to reach significance (mean = 22464 µm², P = 0.060). None of the other pairwise comparisons between materials was significant (all P >0.05).
In summary, the surgery of the superior semicircular canal does not affect the cross-sectional area in Rosenthal's canal, since the pairwise comparisons between the plugged and the control conditions showed significant differences only for the bone group (smaller area in the lower basal turn). The results suggest that only the bone used for the plugging material resulted in a decrease in the cross-sectional area of the Rosenthal's canal.
Cell Density
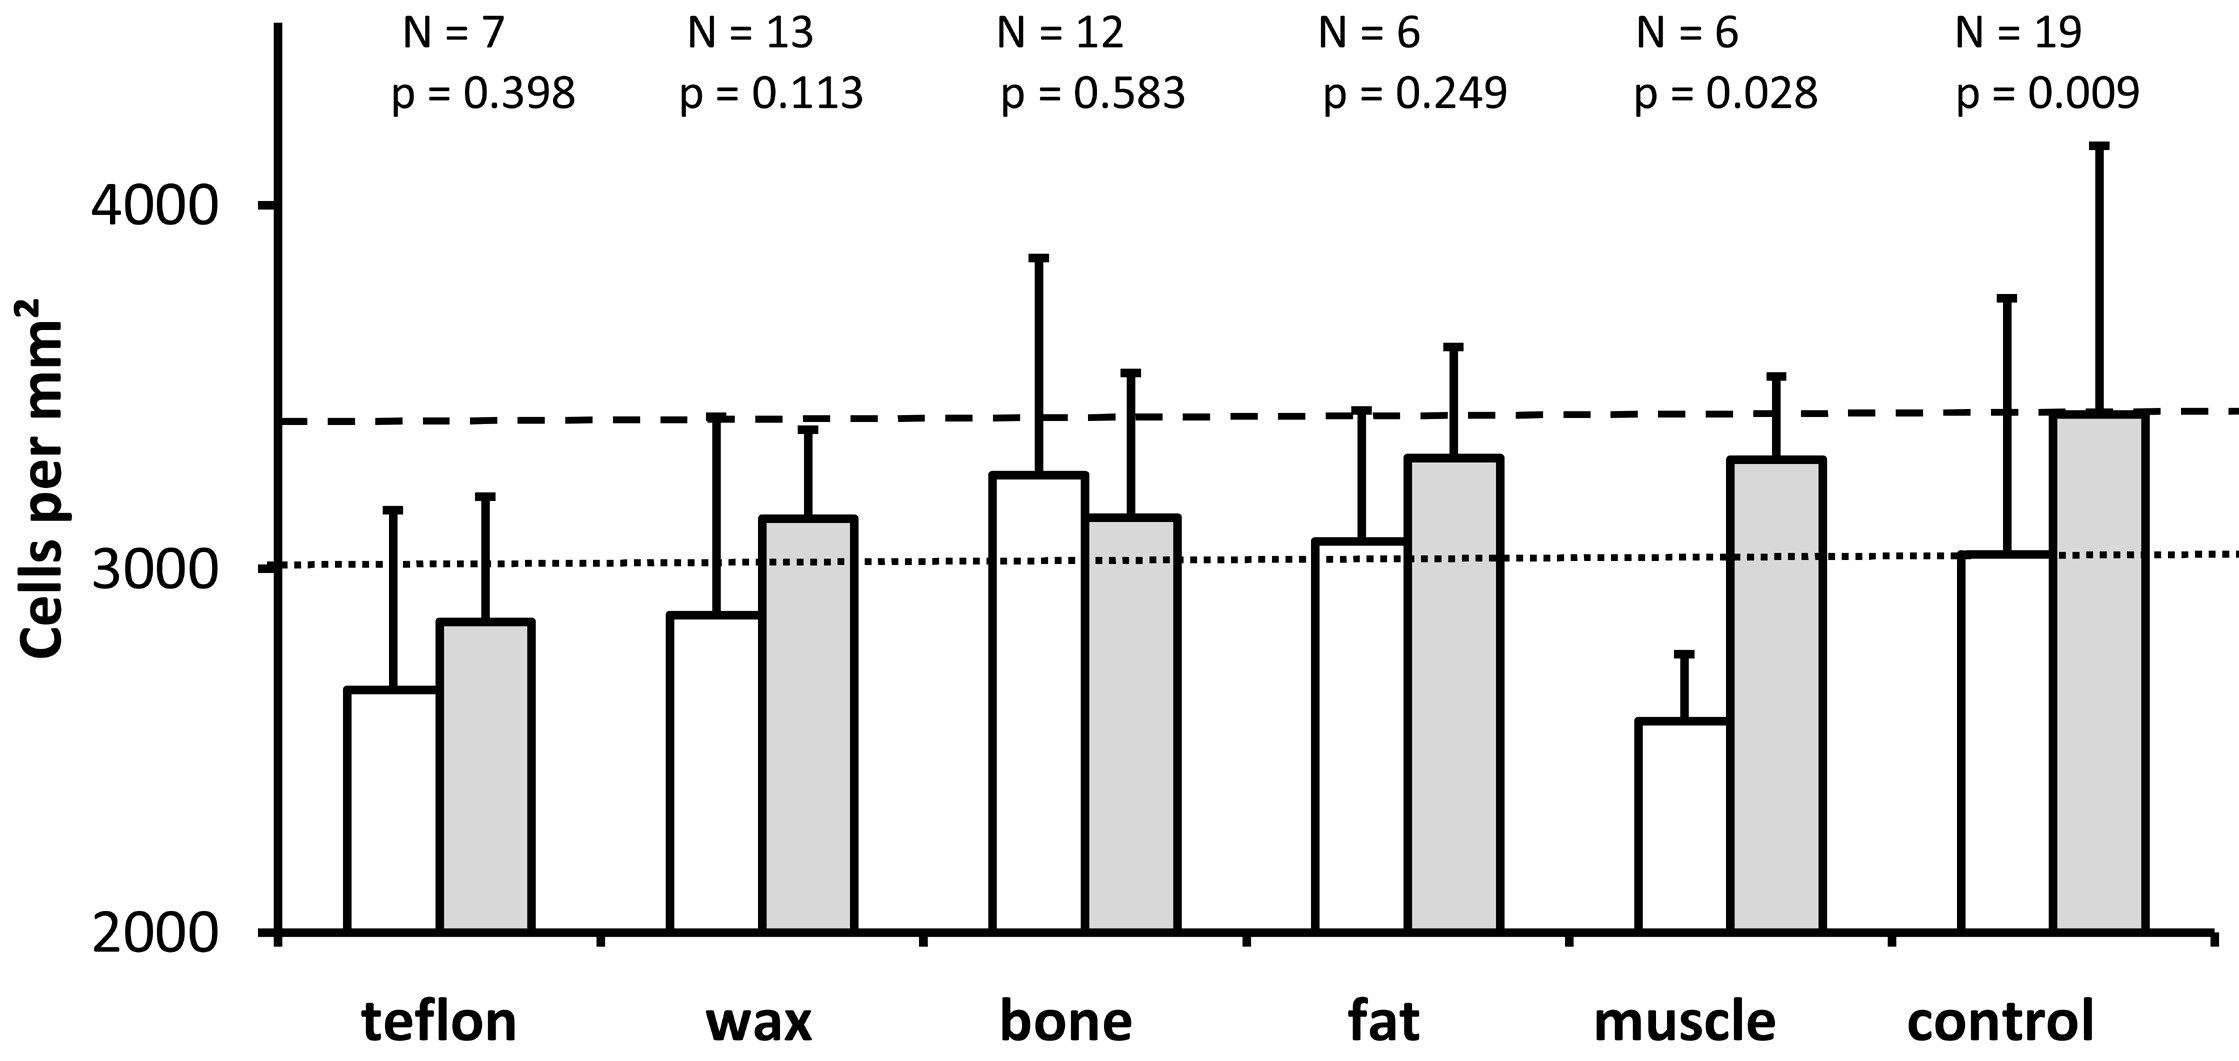
We measured the density of spiral ganglion neurons as a proportion of the number of cells to the cross-sectional area of Rosenthal's canal. As shown in Figure 7, except for ears plugged with bone, the density of spiral ganglion neurons was higher in the upper basal turn (represented by the gray bars) than in the lower basal turn (represented by the white bars). The difference was statistically significant only for the control group (Wilcoxon, P = 0.009) and the muscle group (P = 0.028), but not for the other four materials (P >0.05). Kruskal Wallis tests revealed no statistically significant difference in spiral ganglion neuron density among the study groups, neither in the lower basal turn (P = 0.132) nor in the upper basal turn (Kruskal Wallis, P = 0.140).

Figure 7. The graph illustrates the mean and standard deviation of the density of spiral ganglion cells in the area of Rosenthal's canal (sum of the cells counted in each of the two mid-modiolar sections from each ear divided by the sum of the cross-sectional areas of Rosenthal's canal measured in the same two mid-modiolar sections from each ear) for the lower basal turn (white bars) and the upper basal turn (gray bars) for all groups studied. As it is indicated above each pair of bars for the different treatment groups, the number of ears analyzed and the Wilcoxon P values are provided for comparison of spiral ganglion cell density between the lower and upper basal turns. The horizontal dotted line indicates the mean spiral ganglion cell density for the lower basal turn in the control group. The horizontal dashed line represents the mean spiral ganglion cell density of the upper basal turn in the control group. The Kruskal Wallis tests reveal no significant differences in the density of spiral ganglion cells between treatment groups for lower basal turn (P = 0.132) and upper basal turn (P = 0.140).
Intercellular Edema
We performed a semi-quantitative assessment to distinguish between the groups with regard to the presence of perineuronal edema in the spiral ganglion (Figures 3, 8). All groups showed a higher mean grade of intercellular edema in the lower basal turn when compared to the upper basal turn, but this difference was statistically significant only in the muscle (P = 0.023) and wax (P = 0.005) groups. The Kruskal Wallis test found a statistically significant effect of the material on the grade of edema in the lower basal turn (P = 0.015) but missed the statistically significant level in the upper basal turn (P = 0.064). In the pairwise Mann Whitney U test that followed, the muscle group had a significantly higher grade of edema than the control group, and the fat group had a significantly lower grade of edema than the wax and muscle groups (all P <0.05; refer to the horizontal double arrows in Figure 8). There were no statistically significant differences in all other pairwise comparisons (P >0.05). The fat group showed the least edema among all the groups (including the control group). Contrary to the fat group, the muscle group showed the highest mean edema grade in the lower basal turn.
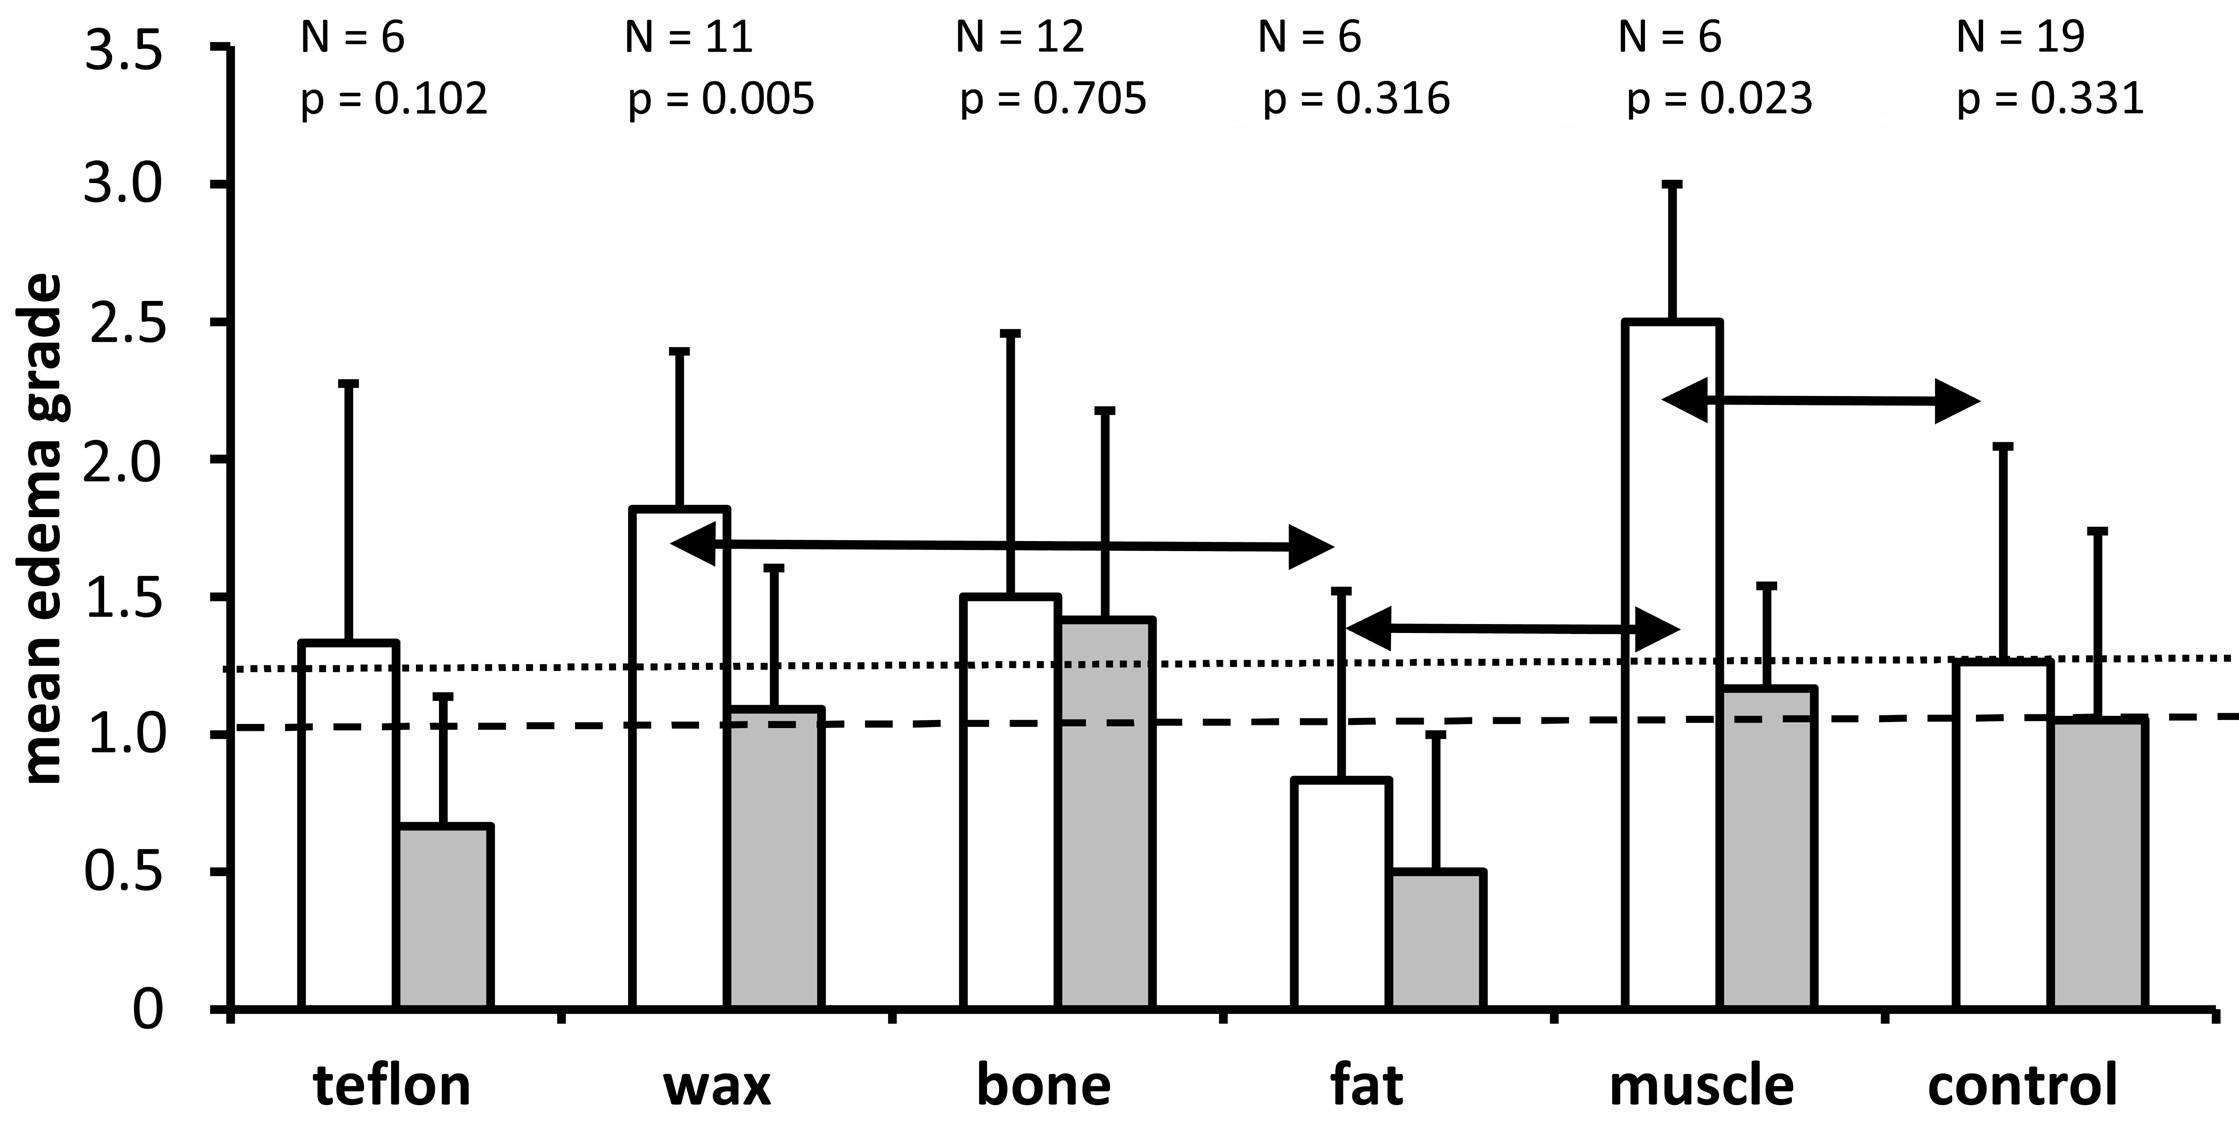
Figure 8. A graph showing the mean and standard deviation of edema grades for each of the treatment groups and the non-operated control group for the lower basal turn (white bars) and the upper basal turn (gray bars). As it is indicated above each pair of bars for the different treatment groups, the number of ears analyzed and the Wilcoxon P values are provided for comparison of edema grades between the lower and upper basal turns. The horizontal dotted line indicates the mean edema grade for the lower basal turn in the control group. The horizontal dashed line represents the mean edema grade of the upper basal turn in the control group. The Kruskal Wallis tests indicate that treatment has a significant impact on the grade of edema in the lower basal turn (P = 0.015) but misses the significance threshold in the upper basal turn (P = 0.064). The horizontal double arrows indicate that there is a significantly higher grade of edema in the muscle group compared to the control group, as well as a significantly lower grade of edema in the fat group compared to the wax and muscle groups. The other comparisons between groups were not significant (P >0.05).
In previous studies, the closure of a superior semicircular canal with bone wax led to a higher incidence of hearing loss in humans compared with the use of bone paté [4,16]. Data from a study with gerbils [3] show that the degree of adverse tissue reactions in the middle ear and around the superior semicircular canal was significantly more pronounced using bone wax and fat as compared to Teflon and bone paté/chips for plugging. In a study with gerbils [3], it was found that the level of adverse tissue reaction in the middle ear and around the superior semicircular canal was significantly greater when bone wax and fat were used as plugging materials in comparison to Teflon and bone paté/chips. There was also evidence that inflammatory reactions in the middle ear were more severe with bone wax compared to other materials used in chinchillas [6] and guinea pigs [17]. Our observations led us to hypothesize that the cochlea of ears with bone wax plugs would appear to show more damage than those with bone, muscle, or Teflon plugs, which may theoretically lead to a loss, shrinkage, or loss of density of spiral ganglion neurons [7-13].
Cell Number
As shown in Figure 4, plugging with Teflon, wax, bone, and muscle, compared to a control group, resulted in a significant reduction in the number of cells in the lower basal turn, which was located closer to the plugging site. In the upper basal turn (further away from the plugging site), treatment had no significant effect on the number of spiral ganglion neurons.
Contrary to the large inflammation seen in the middle ear caused by wax and the smaller level of inflammation caused by bone and Teflon [3], in the current study, however, there was no significant difference in the number of spiral ganglion neurons between the four treatment groups with Teflon, wax, bone and muscle (Figure 4). The difference in cell number of the lower basal turn was evident only between the bone and the fat groups. In this respect, the higher incidence of hearing loss evident in surgical cases involving bone wax in comparison to bone paté in humans [4,16] might be explained by other factors, such as an accidental overapplication of wax in surgical cases [18]. There would be excessive deposition of material in the superior semicircular canal towards the basal turn of the cochlea, which could cause damage in the area. An in-depth analysis of the application of bone wax showed that the wax had remained confined to the surgical site and had not extended to the common crus and superior semicircular canal ampulla [3]. We believe that this may provide some insight into why, following the introduction of bone wax into the superior semicircular canal in gerbils, we did not observe more extensive pathology in the spiral ganglions as compared with Teflon or bone plugging.
In the present study, we found that all plugging materials except for fat caused a significant reduction in the number of cells in the lower basal turn compared with the control group. During the pairwise comparison between the materials, fat and bone proved to have a significant difference, while all the other comparisons between the materials were not significant (Figure 4). The results of Kruskal Wallis analysis showed that the treatment had no significant effect on the upper basal turn (P = 0.304). The results suggest that plugging with different materials was, on average, more detrimental to the number of neurons in the lower basal turn, since it is closer to the plugging site, as compared to the upper basal turn, which is more distant. Based on the evidence shown in Figure 4, we were unable to distinguish between the effects of the isolated surgical opening of the superior semicircular canal and the effects of the different plugging materials on the number of neurons in the lower basal turn. Given the differences in the inflammatory effects of wax, Teflon, and bone in the middle ear [3], as well as the similar effects of these plugging materials on the number of neurons in the lower basal turn, it may be possible that the surgical procedure contributed to the loss of spiral ganglion neurons in the lower basal turn.
Cell Size
Loss of cells is regarded as a certain sign of irreversible tissue damage, but atrophy of cells is indicative of reversible tissue damage, as shown in the auditory pathway of gerbils [19]. Figure 5 illustrates the highly complex pattern of cell size associated with different treatment groups in the lower and upper basal turns. Compared with the control group, this study found that spiral ganglion neurons in the lower basal turn were significantly smaller after plugging with bone, whereas they were significantly larger after plugging with fat and muscle (Figure 5). Despite our efforts, we were not able to determine in the present study the cause of the increase in cell size.
As with heart and skeletal muscle cells, ganglion cells are permanent in nature, which means that they cannot be divided or replicated. A possible adaptive response to stress could involve a hypertrophy of cell organelles such as mitochondria or endoplasmic reticulum [20]. In our light microscopic analysis of the paraffin sections stained with hematoxylin and eosin, however, we did not observe histological evidence of fat accumulation or vacuolation.
There is a significant variation in spiral ganglion cell size (cross-sectional area) with cochlear location and age in postnatal gerbils [21]. According to our results (Figure 5), the cells measured (approximately 70 µm² for the lower basal turn and 65 µm² for the upper basal turn) were smaller than those reported (113 µm² for the lower basal turn and 135 µm² for the upper basal turn) by Echteler and Nofsinger [21]. There may be shrinkage artifacts of tissues ranging from 5% to 70% depending on the type of histological processing [22]. Due to the differences in histological processing and methodological details of cell size determination between studies, a direct comparison between our measurements and those of other studies is not possible; however, Echteler and Nofsinger also found larger cells in the lower basal turn and smaller cells in the upper basal turn [21]. Furthermore, there is a difference in the age and weight of the animals, which complicates the direct comparison among different studies.
Rosenthal's Canal
As plugging the superior semicircular canal with Teflon, fat and muscle does not significantly affect the size of Rosenthal's canal (Figure 6), this suggests that surgery to the superior semicircular canal per se does not reduce its cross-sectional area. Based on the comparison of the different treatment methods, only plugging the superior semicircular canal with bone was associated with a significantly smaller cross-sectional area of Rosenthal's canal of the lower basal turn in comparison with controls (P <0.001), fat (P = 0.024), muscle (P = 0.005) and Teflon (P = 0.01).
Keithley et al. [23] found that the cross-sectional area of Rosenthal's canal was significantly smaller in older gerbils (36-42 months) than in young gerbils (2 months). This finding suggests that the bony labyrinth undergoes some remodeling in certain situations. Despite the differences in histologic processing, we observed similar dimensions to Rosenthal's canal (lower basal turn 0.024 mm2) as documented in the literature (0.027 to 0.06 mm2 in gerbils aged 24-30 months) [23].
Among all the bones in the human body, the otic capsule has the highest density. The cochlea has a minimal rate of remodeling in comparison with other bones, so fractures of the cochlea usually heal by fibrous scar formation instead of osseous healing [24,25]. Among the main factors preventing bone remodeling is a protein called osteoprotegerin, which is produced in the soft tissue of the cochlea and diffuses into the surrounding otic capsule [26]. Another protein, RANKL (receptor activator of nuclear factor κB ligand), is produced by osteoblasts, endothelial cells, and fibroblasts, and functions with osteoprotegerin in competition with the receptor RANK (receptor activator of nuclear factor κB) located on the osteoclasts. The osteoprotegerin inhibits osteoclast activation when bound to RANK, while RANKL promotes osteoclast activation when bound to the same receptor [27,28]. There is a high ratio of osteoprotegerin mRNA to RANKL in the soft tissues of the cochlea (1027:1), a lower ratio in the otic capsule (29:1), and only a 1:1 ratio in the femur [29]. In healthy adult temporal bones, there is a centrifugal gradient of turnover rate rising from 0.1% in the innermost perilabyrinthine zone (adjacent to the spiral ligament) to 10% per year at the capsular periphery [30-32]. These characteristics of the otic capsule could explain the difference in the responses to damage to the petrous bone perceived as pronounced tissue reactions in the middle ear as opposed to moderate changes in the cochlea after damage.
It was discovered that the osteoprotegerin knockout mice (deficient in osteoprotegerin) developed both sensorineural and conductive hearing loss [33]. The osteoprotegerin deficiency resulted in the demyelination and degeneration of the cochlear nerve in vivo. It has been demonstrated that osteoprotegerin promotes the survival of neurons and neural stem cells in the cochlea. The results indicate that osteoprotegerin may play a novel role in regulating the survival of spiral ganglion neurons. It has also been suggested that osteoprotegerin deficiency may lead to spiral ganglion neuron degeneration. Moreover, there is evidence that the interplay between bone and neurons continues in adulthood and is mediated at least in part by osteoprotegerin [33].
Considering that some remodeling of the bone around Rosenthal's canal (reduction in size) should have occurred after the superior semicircular canal was plugged with bone paté/chips derived from non-otic capsular bone, one could speculate that such remodeling could be due in part to factors released by the transplanted bone (e.g., RANKL) which could prevent remodeling-inhibiting mechanisms (e.g., inhibition of osteoprotegerin) within the otic capsular bone. The inhibition of osteoprotegerin following bone plugging may in turn result in a reduction in the number (Figure 4) and size (Figure 5) of spiral ganglion neurons in the lower basal turn, which is close to the surgical site.
Cell Density
Loss of spiral ganglion neurons has been shown to be associated with a decrease in density of spiral ganglion neurons [22,33,34]. In the present study, all groups except for the bone group exhibited a higher density of spiral ganglion neurons in the upper basal turn compared to the lower basal turn, but this difference was only significant in the control and muscle groups (Figure 7). Neither the lower basal turn nor the upper basal turn showed significant differences between the experimental groups (Kruskal Wallis, P >0.05). Despite the higher number of spiral ganglion neurons in the lower basal turn in comparison to the upper basal turn, the cross-sectional area of Rosenthal's canal was larger, resulting in similar densities of spiral ganglion neurons in both regions of the ganglion. There is no difference between the density of spiral ganglion neurons between the five half turns of the cochlea and after postnatal day 7, the cell density did not vary throughout the spiral ganglions [21,23]. The different scale in density observed in our study (3000 cells/mm²) compared to Keithley's study (1000 cells/mm²) [23] and Nofsinger's study (2000 cells/mm²) [21] can be attributed to the different thickness of the histological sections analyzed (10 µm in the present study versus 2 µm in Keithley's study versus 4 µm in Nofsinger's study). Our results suggest that the density of spiral ganglion neurons was not an appropriate parameter for detecting cochlear damage due to a plugging of the superior semicircular canal.
Intercellular Edema
The pattern of the degree of intercellular edema of the spiral ganglions across treatment groups in the lower basal turn and upper basal turn differed from the patterns of the other parameters analyzed (cell number, cell size, Rosenthal's canal, cell density, Figures 4-7). For example, the degree of intercellular edema was not related to the size of the spiral ganglion neurons in different groups (see Figures 5 and 8 for comparison of fat and muscle). The smallest edema grades were identified in the fat group and the highest in the muscle group in the lower basal turn, however, the pathologic relevance of these findings remains unclear. There was a greater degree of edema in the lower basal turn in comparison to the upper basal turn (Figure 8). This indicates that the proximity of the plugging site to the cochlea contributes to the observed pathologic reaction.
Limitations
In this study, we report on the number of cells, cell size, size of Rosenthal's canal, cell density, and interstitial edema of the gerbil. We also report on how these might be altered by plugging the superior semicircular canal with different materials. Our study has some limitations. For example, we are not able to ascertain how much influence the surgery in fact has had on the results presented in this study. Our study should have included a second group of controls, in which the superior semicircular canal was opened and closed but not plugged with any material. Future studies will examine this issue in more detail.
The majority of plugging materials used in gerbils resulted in cell loss in the lower basal turn of the spiral ganglions after blocking the superior semicircular canal. As compared to the upper basal turn, structural changes such as spiral ganglion cell loss, perineuronal edema, or remodeling of Rosenthal's canal appeared more pronounced in the lower basal turn. This differential effect on the lower and upper basal turns could be attributed to the distance from the plugging site. As a plugging material, bone wax does not cause more damage to the spiral ganglion than bone, muscle, fat, or Teflon, but it does cause a high inflammatory response in the middle ear as demonstrated previously. Despite showing a low degree of middle ear inflammation, bone could be associated with some remodeling of the Rosenthal's canal. Teflon caused a mild inflammatory response in the middle ear and had little effect on the spiral ganglion. In gerbils, plugging with fat and muscle resulted in a closure of the fistula in less than 50% of the cases. Therefore, fat and muscle should not be considered as first-choice materials.
Received date: January 11, 2022
Accepted date: March 31, 2022
Published date: May 20, 2022
The authors would like to thank C. Woegerbauer for assistance with histological processing and U. Schreiter for sectioning the specimen. S. Kopetschek performed the photo documentation, drawing and measuring the regions of interest and transferring the raw data to Excel spreadsheets. Furthermore, we would like to thank Dr. S. Marcrum for providing us with assistance with the English language.
The final version of the manuscript has been approved by all authors and has been submitted for publication. The authors warrant that the article is their original work, has not been published elsewhere, and is not under consideration for publication elsewhere. There has been no presentation of the manuscript at any of the meetings in the past.
Animals were used in this study in accordance with the "European Directive 2010/63/EU on the protection of animals used for scientific purposes" and the current "German animal welfare act." The experiments were approved by the "Regierung der Oberpfalz (54-2532.1-48/12)."
This research has received no specific grant from any funding agency either in the public, commercial, or not-for-profit sectors.
There are no conflicts of interest declared by either the authors or the contributors of this article, which is their intellectual property.
It should be noted that the opinions and statements expressed in this article are those of the respective author(s) and are not to be regarded as factual statements. These opinions and statements may not represent the views of their affiliated organizations, the publishing house, the editors, or any other reviewers since these are the sole opinion and statement of the author(s). The publisher does not guarantee or endorse any of the statements that are made by the manufacturer of any product discussed in this article, or any statements that are made by the author(s) in relation to the mentioned product.
© 2022 The Author(s). This is an open-access article distributed under the terms of the Creative Commons Attribution 4.0 International License (CC-BY). In accordance with accepted academic practice, anyone may use, distribute, or reproduce this material, so long as the original author(s), the copyright holder(s), and the original publication of this journal are credited, and this publication is cited as the original. To the extent permitted by these terms and conditions of license, this material may not be compiled, distributed, or reproduced in any manner that is inconsistent with those terms and conditions.


The groundbreaking study illuminates the complex mechanisms of nerve regeneration within fasciocutaneous flaps through meticulous neurohistological evaluation, setting a new benchmark in experimental microsurgery. It challenges existing paradigms by demonstrating the transformative potential of sensory neurorrhaphy in animal models, suggesting possible clinical applications. The data reveal a dynamic interplay of nerve recovery and degeneration, offering critical insights that could revolutionize trauma management and reconstructive techniques. By bridging experimental findings with hypothetical clinical scenarios, this article inspires continued innovation and research, aimed at enhancing the efficacy of flap surgeries in restoring function and sensation, thus profoundly impacting future therapeutic strategies.
Kwok P, Gleich O, Utpatel K, Bohr C, Strutz J. Plugging of a dehiscent superior semicircular canal damages the spiral ganglion regardless of the material used. Arch Otorhinolaryngol Head Neck Surg 2022;6(2):1. https://doi.org/10.24983/scitemed.aohns.2022.00160
 PDF
PDF