Objectives: The measurement of glycated hemoglobin (HbA1c) has been recently recommended for the diagnosis of diabetes. There are many diseases and conditions influencing HbA1c values, but hemoglobin (Hb) levels are not usually taken into account in the interpretation of HbA1c in the screening of diabetes. This study examined the association between Hb and HbA1c, together with the factors possibly affecting HbA1c in Japanese without anemia or diabetes.
Methods: Subjects were 32605 individuals (16706 men) aged 30–75 years from the general health check-up program with fasting plasma glucose (FPG) < 7 mmol/L and HbA1c < 6.5% (48 mmol/mol) without anemia, under treatment of anemia, self-reported diabetes, chronic kidney disease, liver disease, rheumatoid arthritis or collagen diseases. Multivariable linear regression analysis was performed to analyze the effect of Hb on HbA1c, after adjusting for age, body mass index (BMI), FPG, and alcohol and smoking habits in men and women separately.
Results: Men had more unfavorable cardiovascular risk profiles and higher hematological parameters compared with women. In both men and women, age,
Conclusion: HbA1c levels decreased with increasing Hb levels, independent of FPG and covariates in Japanese men and women without diabetes or anemia. There was an interaction between sex and Hb in the effects on HbA1c. This should be appreciated when interpreting HbA1c.
Glycated hemoglobin (HbA1c) levels reflect the average levels of glycemia over a 1–2 month period because of the life span of erythrocytes. Thus, HbA1c has been the gold standard for the assessment of glycemic control in patients with diabetes for the past three decades, and has been recently recommended for the use of HbA1c level ≥ 6.5% in the diagnosis of diabetes [1-3].
In the setting of hyperglycemia, the highly permeable erythrocyte membrane allows exposure of hemoglobin (Hb) to elevated intracellular glucose levels. HbA1c is formed by the non-enzymatic glycation of N-terminal valine on the beta chain of Hb in a two-step Maillard reaction [4]. Erythrocyte turnover, as well as Hb features and glycation, are known to influence HbA1c values, independent of glucose concentrations [4]. Thus, the interpretation of HbA1c values may have limitations. Moreover, HbA1c is a ratio of glycated hemoglobin to total Hb [5]. Hb value may be an important contributing factor to HbA1c level, and there may be inter-individual differences in the relationship between Hb and HbA1c values. Nevertheless, Hb levels have not always been taken into account in the use of HbA1c in routine clinical practice.
The aim of this study was to investigate the association between hematological parameters, especially Hb and HbA1c, together with the factors affecting HbA1c including glucose values in Japanese men and women without diabetes or anemia, by a cross-sectional analysis.
Subjects
The study comprised of 32605 individuals (16706 men) aged 30–75 years and with fasting plasma glucose (FPG) < 7 mmol/L and HbA1c < 6.5% (48 mmol/mol). The study excluded individuals with anemia (men: Hb < 13.5 g/dL, women: Hb < 11.5 g/dL), Hb levels above the reference range (men: Hb > 17.5 g/dL, women: Hb > 15.5 g/dL), under treatment of anemia, self-reported diabetes, chronic kidney disease (men: creatinine > 1.6 mg/dL, women: creatinine > 1.2 mg/dL), liver disease (i.e. hepatitis B or C), or those with rheumatoid arthritis or collagen diseases. Participants were identified from 74823 individuals (45386 men) in the annual health check-up program at the Josai Hospital Healthcare Center, Tokyo, Japan between January 2003 and December 2003.
Measurements
FPG was determined using the hexokinase UV method (Quick auto neo GLU-HK, Shino-test Co., Ltd, Tokyo, Japan). HbA1c was determined in whole blood by latex agglutination turbidimetry with Determina A1c (Kyowa Medex Co., Ltd, Tokyo, Japan) after standardization by Japan Diabetes Society (JDS) calibration. HbA1c values used in this report were converted from JDS aligned values to National Glycated Standard Program (NGSP) aligned values and International Federation of Clinical Chemistry (IFCC) aligned values according to the formula [6]: NGSP value (%) = 1.02 × JDS value (%) + 0.25% and IFCC value (mmol/mol) = 10.93 × NGSP value (%) – 23.52. The intra- and inter- assay co-efficients of variation for HbA1c were 2.3% and 2.4%, respectively. Hb, hematocrit (Ht), and red blood cell (RBC) counts were measured using the sodium lauryl sulfate-hemoglobin method, RBC pulse wave high value detection method, and sheath flow electrical resistance detection method, with an automated multiple blood count analyzer (Sysmex XE-2100, Sysmex, Kobe, Japan). The mean corpuscular volume (MCV), mean corpuscular hemoglobin (MCH), and mean corpuscular hemoglobin concentration (MCHC) were calculated according to the formula: Ht/RBC × 103, Hb/RBC × 103, and Hb/Ht × 102, respectively.
Information of smoking habits (current, past, none) and alcohol habits (every day, sometimes, none) was obtained from the responses to the self-administrated questionnaires. In the current analysis, past- and non-smoker were grouped as non-current smoker, and the subjects who drink alcohol every day or sometimes were grouped as subjects with alcohol habits.
Statistical Methods
Data were analyzed and reported for men and women, separately.
Univariate regression analysis was performed to test the effects of age, body mass index (BMI), FPG, hematological parameters (Hb, Ht, RBC, MCV, MCH, and MCHC), alcohol habits, and smoking habits, respectively, on HbA1c (%). Next, multivariable linear regression analysis was performed to test the independent effect of hematological parameters (Hb, Ht, RBC, MCV, MCH, and MCHC) on HbA1c. The independent variables tested in this model were those identified as significant in the univariate regression model: i.e., age (continuous), BMI (continuous), FPG (continuous) and Hb (continuous), Ht (continuous), RBC (continuous), MCV (continuous), MCH (continuous), MCHC (continuous), smoking habits (categorical: current smokers versus non-current smokers), and alcohol habits (categorical: yes versus no). Subsequently, the interaction between Hb and sex was tested in the model in which sex was included in the independent variables, and the data from both men and women were analyzed. Because hematological parameters had high co-linearity with Hb, only Hb was used to test sex interaction in the multivariable model.
Finally, the adjusted HbA1c value was calculated for varying Hb level using the equation delivered from the results of the multivariable regression analysis described above, assuming that the individuals were 60 years old and had BMI of 25 kg/m2, FPG of 6.1 mmol/L (impaired fasting glucose: IFG), and smoking and alcohol habits. These values were chosen as an example of individual with abnormal glucose metabolism detected though screening for diabetes in Japan.
Data were analyzed with the SPSS statistical package for Windows version 21.0 (SPSS, Chicago, IL, USA). P-values were based on two-sided tests and the cut-off point for statistical significance was P < 0.05.
Ethical Considerations
This analysis was approved by the Institutional Review Board of Josai Hospital and Tokyo Women’s Medical University and the written informed consent was obtained from the participants.
Characteristics of Participants Analyzed for the Study
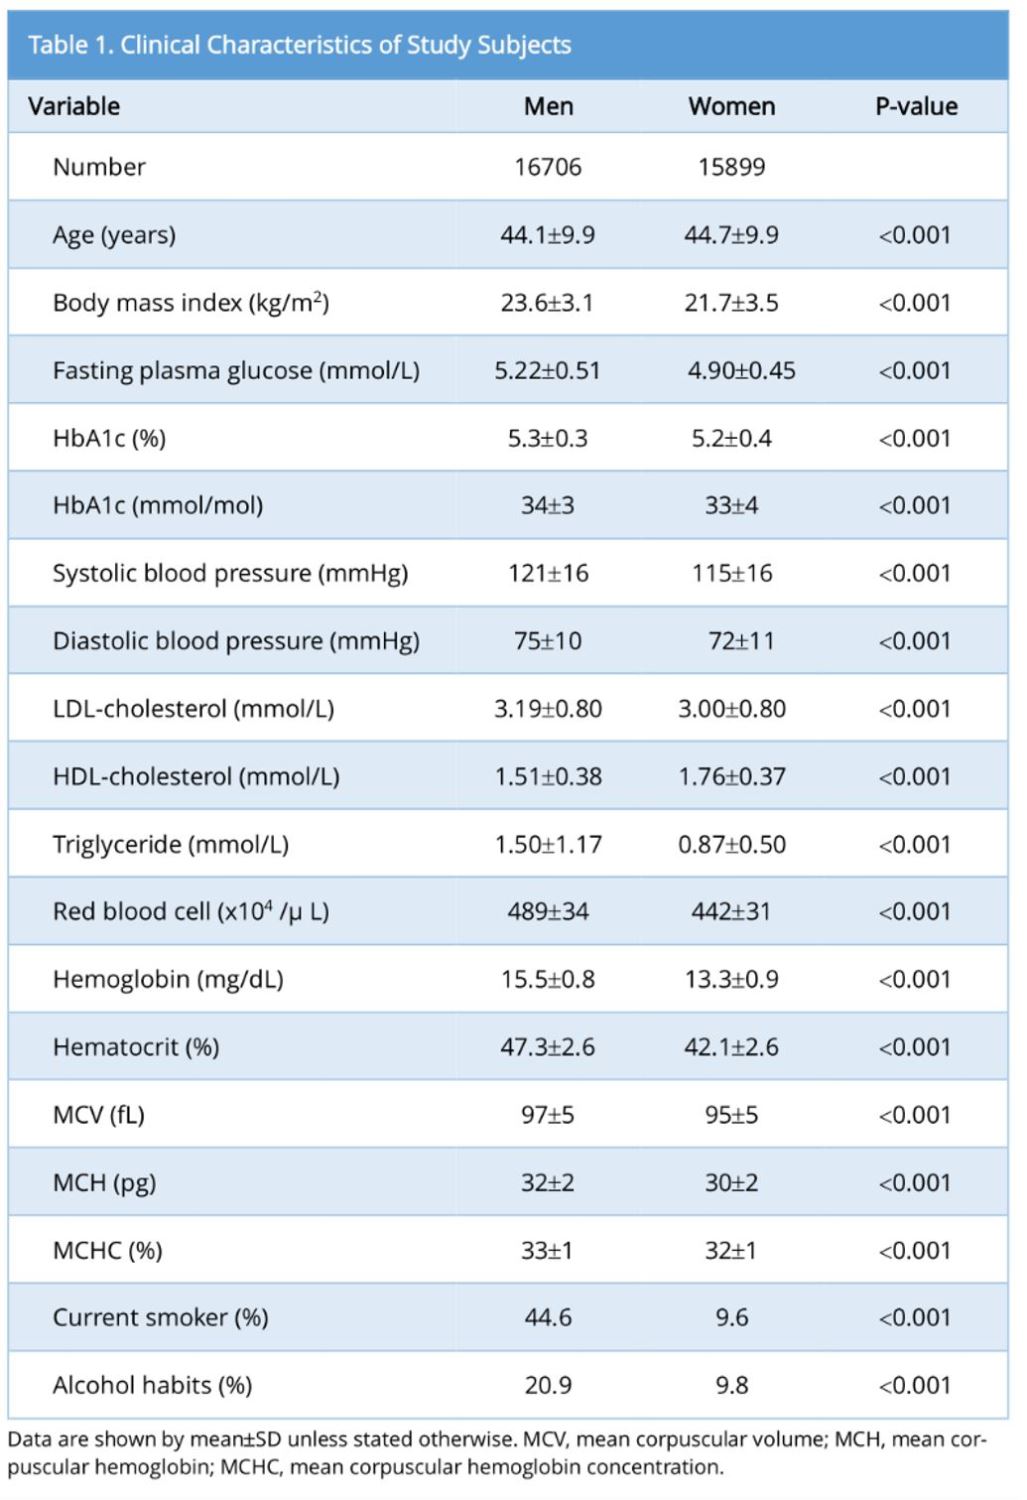
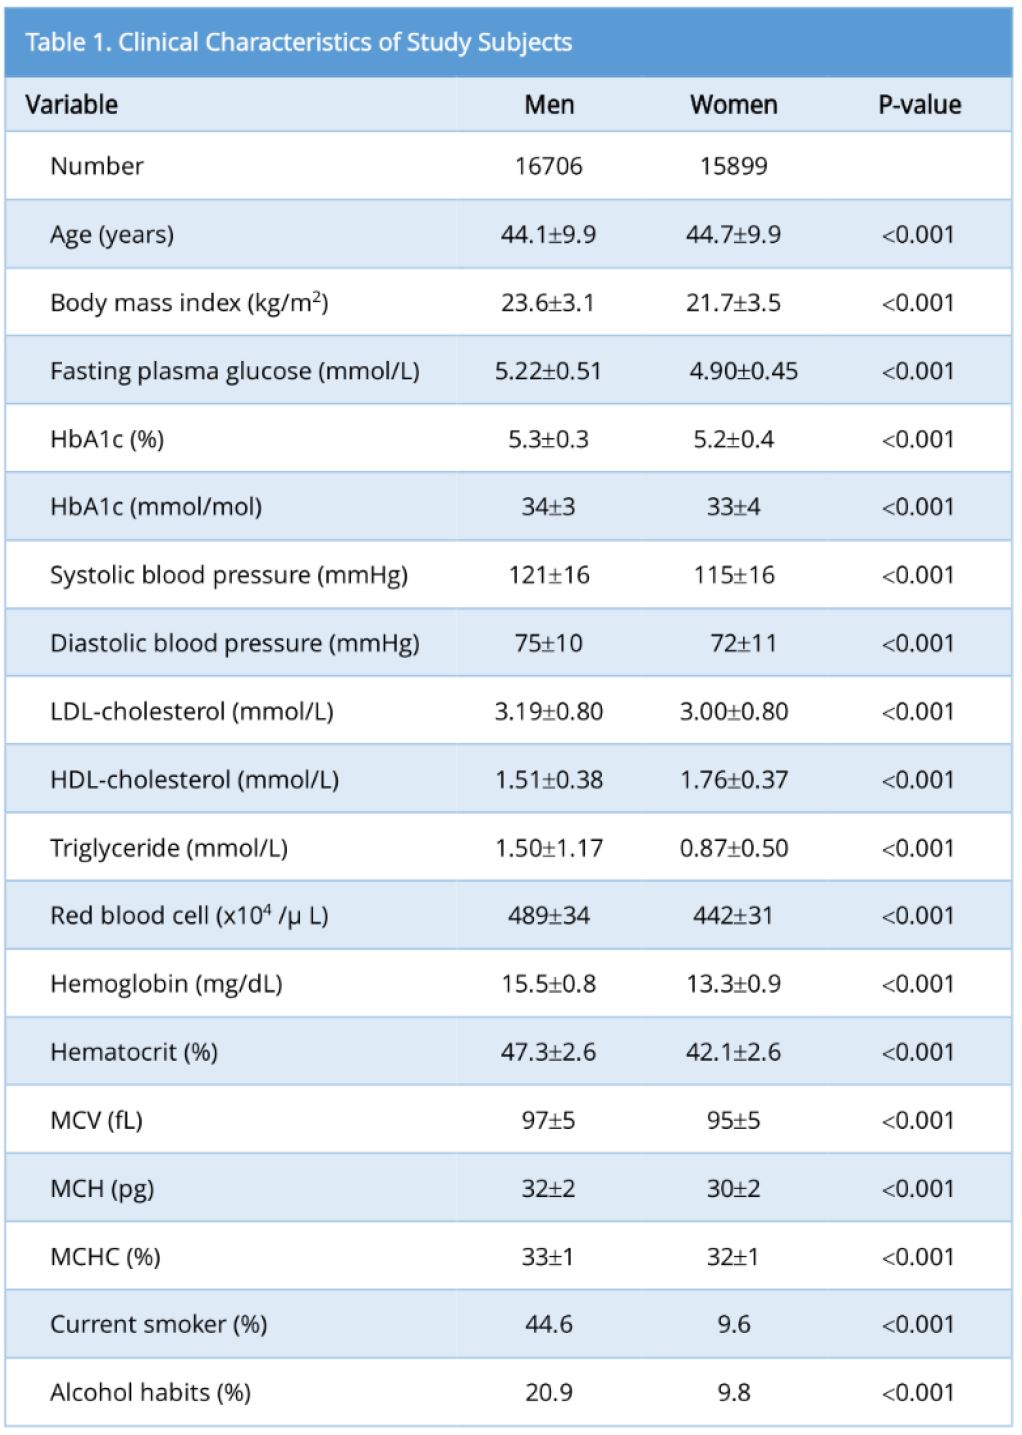
Table 1 shows the characteristics of the participants analyzed in the study. Men had significantly worse cardiovascular risk profiles than women. The hematological parameters: RBC, Hb, Ht, MCV, MCH, and MCHC were higher in men than in women (Table 1).
Effect of Hematologic Parameters on HbA1c
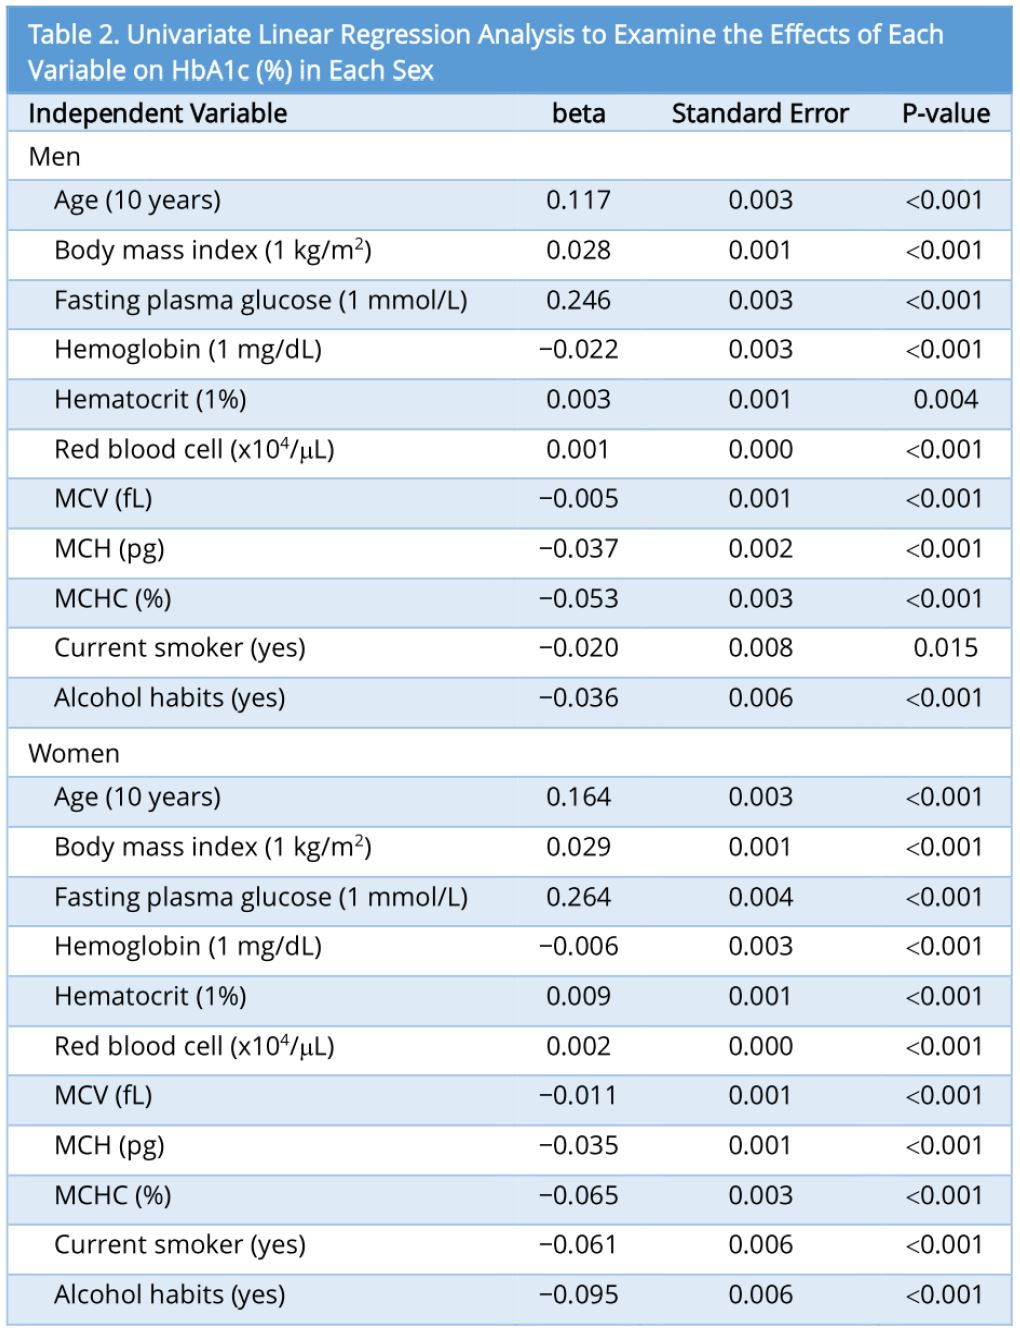
The univariate linear regression analysis showed that age, BMI, FPG, RBC counts, and Ht had positive associations with HbA1c, while Hb and smoking and alcohol habits had negative associations with HbA1c in each sex (Table 2). As for MCV, MCH, and MCHC, all had negative associations with HbA1c in each sex (Table 2).
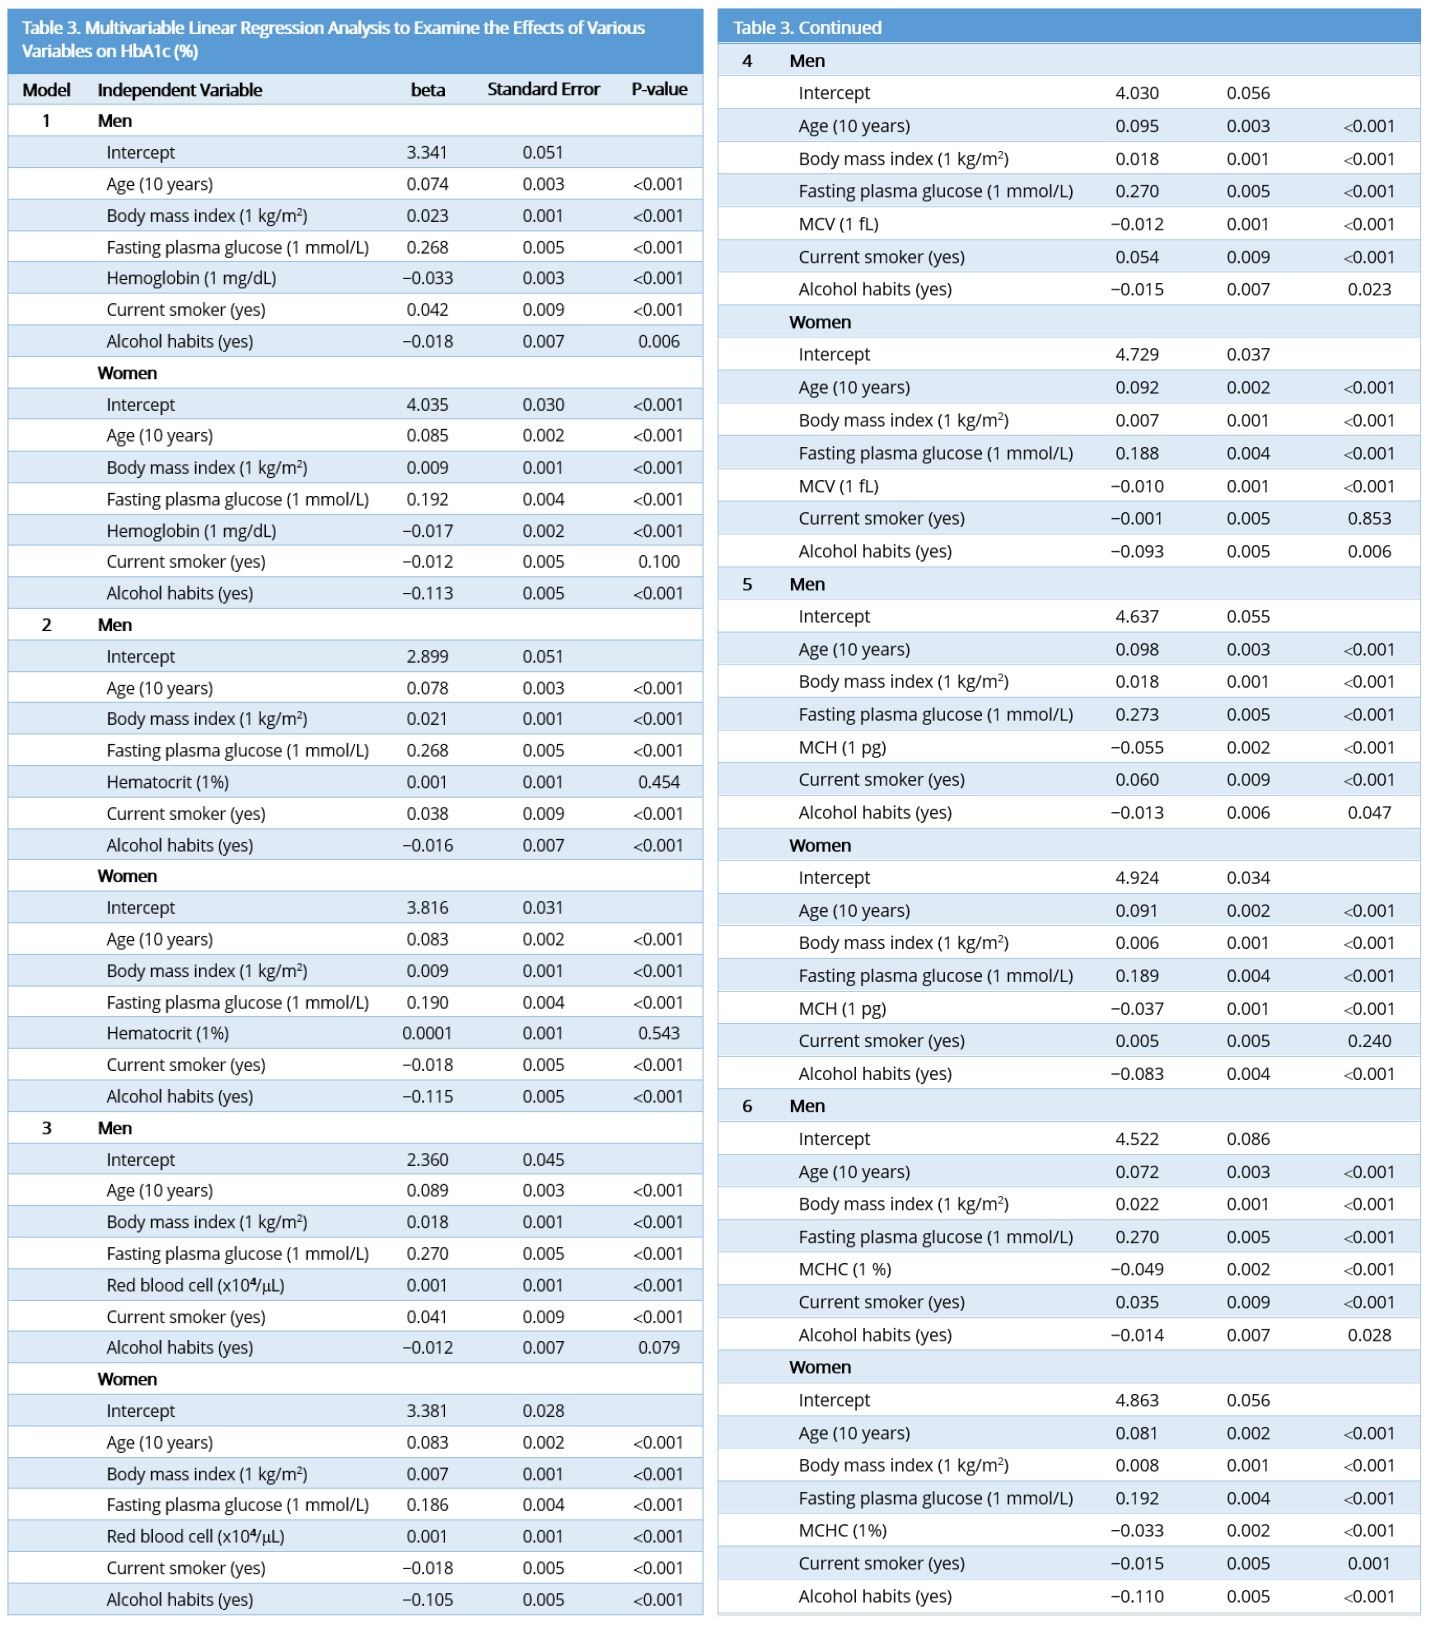
The multivariate linear regression analysis showed that the negative association between Hb and HbA1c remained after adjusting for age, BMI, FPG, and smoking and alcohol habits in each sex (Model 1 in Table 3).
Similarly, the negative association between MCV, MCH, and MCHC and HbA1c remained in the multivariate models adjusted for age, BMI, FPG, and smoking and alcohol habits in each sex (Model 4, 5 and 6 in Table 3). As for RBC, the positive association with HbA1c remained (Model 3 in Table 3) (Table 3).
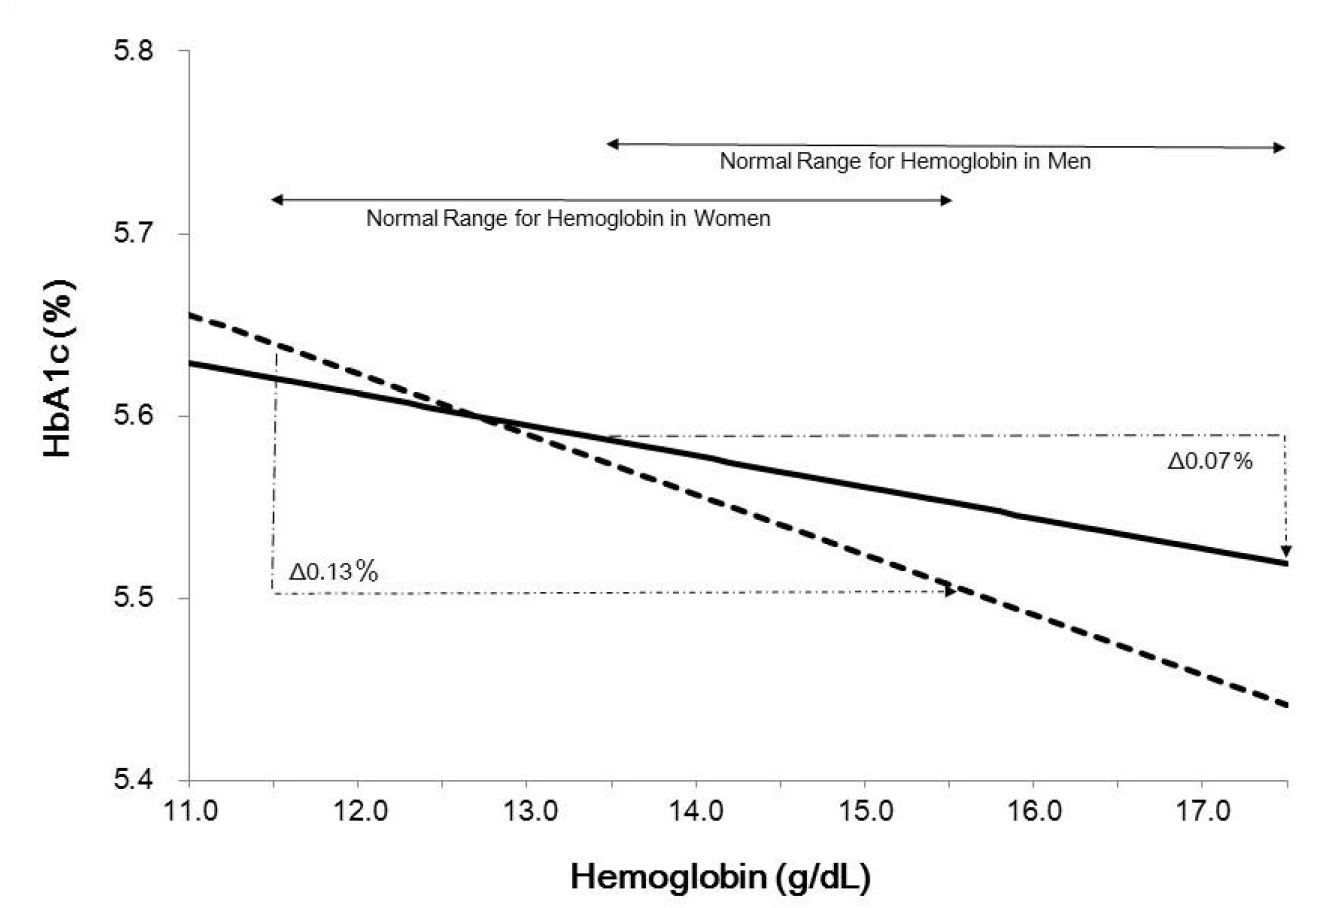
Figure 1 illustrates adjusted HbA1c according to Hb in men or women aged 60 years old and with BMI 25 kg/m2, IFG (FPG 6.1 mmol/L), and smoking and alcohol habits. The following equations (Model 1) were adopted to calculate adjusted HbA1c:
HbA1c (%) = 0.074 x 6 + 0.023 x 25 + 0.268 x 6.1 – 0.033 x Hb + 0.042 – 0.018 + 3.341
HbA1c (%) = 0.085 x 6 + 0.009 x 25 + 0.192 x 6.1 – 0.017 x Hb – 0.012 – 0.113 + 4.035
The adjusted HbA1c decreased with increasing Hb. In this assumption, the adjusted HbA1c differed by 0.07% for men and 0.13% for women in the normal range of Hb for each sex (men: 13.5–17.4 g/dL, women: 11.5–15.4 g/dL) and the sex difference of adjusted HbA1c ranged from 0.01 to 0.05% (from 0.2 to 0.4 mmol/mol) in the normal range of Hb for both sexes: Hb 13.5–15.4 g/dL (Figure 1). Figure 1 suggests that the slopes for men and women are different. A multivariable linear regression analysis to examine the interaction between sex and Hb in the effects on HbA1c indicated that the interaction was significant (P < 0.05). In this analysis, age, BMI, FPG, alcohol and smoking habits, and Hb multiply sex (sex was coded as men = 0 and women = 1) were included as independent variables, in addition to sex and Hb.

HbA1c is a tool for the identification of subjects with diabetes [1-3]. Our study showed that HbA1c levels decreased with increasing Hb levels at any given FPG level independent of age, BMI, and smoking and alcohol habits among non-diabetic men and women without anemia, liver or renal dysfunction, etc. Furthermore, sex had an independent association with HbA1c as well as an interaction effect on the association between Hb and HbA1c.
In our study, HbA1c values adjusted for age, BMI, FPG, and smoking and alcohol habits decreased with increasing Hb in both sexes, and differed even within the normal range of Hb for each sex. This finding may simply reflect the fact that HbA1c is a ratio of glycated Hb to total Hb. In conditions where erythrocyte turnover increases — an increase in RBC counts or a decrease of RBC survival — leads to the reduction of ‘old’ Hb and an increase in ‘new’ Hb [7]. It has been reported that new Hb is less likely to be glycated than old Hb, resulting in lower HbA1c levels [8-10]. A study in twins has shown that 69% of inter-individual variance of HbA1c variance adjusting for age and BMI is attributed to genetic factors, and the remaining 31% is a result of environmental influences [11]. One-third of the inherited variance of HbA1c is associated with the glycation gap [11], the difference between the HbA1c predicted by the glycation of serum proteins and actual HbA1c. This difference is reported to be associated partly with the difference in the RBC trans-membrane gradient, suggesting variations in the degree of glucose entry into the RBC, and 2, 3-diphosphoglycerate and pH levels in the RBC. There may be unidentified genetic loci influencing HbA1c levels via glycemic and non-glycemic pathways in Japanese individuals, as demonstrated in a recent genome-wide association study in European populations that identified 10 genetic loci reproducibly associated with HbA1c [12].
Koga et al. had reported that RBC counts had a positive association with HbA1c, whereas Hb, MCH and MCV had negative associations with HbA1c in pre-menopausal Japanese women without diabetes or anemia [13]. The same approach had not been performed due to incomplete information about menopause in our data; however, the similar trends to Koga’s findings were shown for RBC, Hb, MCV, and MCH in our univariate model. The inverse effect of RBC count and Hb on HbA1c values could be explained by the mechanisms described above: increased erythrocyte turnover which increases RBC counts or decreases RBC survival, leading to decrease of old Hb [7], and resulting in lower HbA1c levels [8-10].
Since MCH and MCHC are indicators of mean Hb amounts and concentrations in RBC, the negative associations between these indicators and HbA1c might reflect stronger effects of Hb than RBC (or Ht) on HbA1c. The MCV, an indicator of mean RBC volume, was correlated with MCH and influenced by iron contents, abrupt bleeding, etc. The reason for the negative association between MCV and HbA1c in our study was not known, but it might reflect the effect of Hb on HbA1c. Further studies will be needed.
In the current study, sex had an independent association with HbA1c levels as well as an interaction effect on the association between Hb and HbA1c. The reason for this difference between sexes is not understood. Sex is an important association factor of HbA1c [4], and the sex hormone estrogen might have affected the rate of glycation. A previous Japanese data has not revealed any significant relation between erythrocyte indices and HbA1c in post-menopausal women [13]. However, there is no information about what extent the lifespan of erythrocytes differs between pre- and post-menopausal women with the same Hb or MCH levels. It is anticipated that HbA1c levels in women before menopause are frequently modified by fluctuations in Hb levels induced by menstruation, although it is not known to what extent these unstable Hb levels influence HbA1c levels.
As shown in Figure 1, HbA1c value in individuals with IFG (FPG 6.1 mmol/L) who have the same age, BMI and social habits are ranging from 5.5% (36.6 mmol/mol) to 5.65% (38.2 mmol/mol). According to the guideline by JDS, HbA1c 5.6% is the threshold for a 75 g oral glucose tolerance test (OGTT) to screen diabetes or impaired glucose tolerance [3]. Thus, not to miss the individuals needing further testing of an OGTT, we should be cautious in interpreting HbA1c.
.jpg)
Figure 1. Relationship between hemoglobin and adjusted HbA1c in men and women aged 60 years, with body mass index 25 kg/m², fasting plasma glucose 6.1 mmol/L, and smoking and alcohol habits. P for sex interaction <0.05. The following equation was adopted to calculate HbA1c (%). For men, HbA1c (%) = 0.074 × 6 + 0.023 × 25 + 0.268 × 6.1 - 0.033 × Hb + 0.042 - 0.018 + 3.341; for women, HbA1c (%) = 0.085 × 6 + 0.009 × 25 + 0.192 × 6.1 - 0.017 × Hb - 0.012 - 0.113 + 4.035.
Potential limitations to this study should be noted. First, our study was based on health check-up examination data at a single point in time, and the estimated HbA1c was made by adjustment for classical risk factors for HbA1c. Moreover, the study analyzed data from single center, so generalizing these findings should be done with caution. However, a similar trend has been reported in a study of non-anemic and non-diabetic Koreans [14] as well as non-anemic and non-diabetic Japanese pre-menopausal women [13], although the statistical method used for the analysis was not the same. Second, we did not have the data on a 75 g OGTT for the diagnosis of diabetes. FPG does not always reflect mean glucose levels, and the contribution of FPG to HbA1c is smaller than postprandial glucose in low ranges of HbA1c [15]. However, FPG had a strongly positive linear association with HbA1c. Third, it is not known to what extent the measurement method of HbA1c influenced the relationship between Hb and HbA1c, and should be examined further in the future. Of note, the Korean study [14] used the same measurement method and the same kit as our study. Fourth, it has been reported that HbA1c levels are decreased in people taking high doses of Vitamin C, D, and E [4], and we could not identify or exclude such individuals from the data analysis in our study. Fifth, red cell distribution width (RDW) may also have influenced on HbA1c, although the screening program has not included RDW measurements. Seventh, it is well-known that thyroid dysfunction relates to iron deficiency anemia, increases red cell turn over, and probably modifies HbA1c values. However, information of thyroid disease was not available due to lack of item in the questionnaires. Nevertheless, we excluded participants with anemia to minimize this limitation. Eighth, doses and duration of smoking and alcohol may affect HbA1c values. However, we could not examine it due to limited information of these variables. Finally, information about menopause in women in the study was not available, which might also have affected the sex differences in the relation between Hb and HbA1c observed in the study. Nevertheless, our study included a large sample size and excluded, as far as was possible, individuals who had conditions that could potentially affect HbA1c.
In conclusion, HbA1c levels decreased with increasing Hb levels, independent of age, sex, BMI, FPG, and smoking and alcohol habits in Japanese men and women without diabetes or anemia. There was an interaction between sex and hemoglobin in the effects on HbA1c. The interpretation of HbA1c values should be cautious in the screening of glucose intolerance.
Received date: September 19, 2017
Accepted date: October 18, 2017
Published date: December 14, 2017
This paper was presented at the 49th Annual Meeting of European Association for the Study of Diabetes in Barcelona, Spain, on September 24, 2013.
None
This study was supported by grants to T.N. from the Japan Diabetes Society, Japanese Ministry of Health, Labour, and Welfare, the Japan Medical Women’s Association, the Tokyo Women’s Medical University Association, the Yayoi Yoshioka Research Fund, and the Yazuya Food and Health Research Foundation.
© 2017 The Author(s). This is an open-access article distributed under the terms of the Creative Commons Attribution 4.0 International License (CC-BY).

The authors responded to the comments appropriately.
The authors have addressed my concerns and the manuscript has been revised properly. I recommend that the article is suitable for publication.
Nakagami T, Oya J, Kasahara T, Uchigata Y. Effect of hemoglobin levels and sex on HbA1c levels among Japanese population. Diabetes Endocrinol 2017;1(1):3. https://doi.org/10.24983/scitemed.de.2017.00044
 PDF
PDF